Tilting the Index In Your Favor

“Good Ideas Can’t Be Scheduled” is the title of a 2019 blog post by Morgan Housel of Collaborative Fund. His point was that deadlines shouldn’t be placed on good ideas, regardless of field, but the execution of good ideas is the opposite.
One of Blueprint Investment Partners’ best “good ideas” presented itself just like that – unscheduled – at a daunting time, during the height of pandemic-fueled market uncertainty of 2020. But we felt it would create clear advantages for financial advisors and their clients, so we got to work executing our plan.
Unwrapping the Index to Overweight Strength & Underweight Weakness
Our big, new idea involved rolling out one of the largest enhancements to our investment process since inception. Specifically, we wanted to start utilizing individual stocks in our portfolios instead of a basket or index. This shift was born of a simple question:
If trend following the index is a highly effective approach, would it be more effective to break apart the index and apply this same method to its underlying constituents?
The answer, based on our research, is unequivocally yes; unwrapping an index and applying trend following to the individual securities has the potential to produce substantially better results over the long run.
Our firm has always utilized trend following as a means of systematically and objectively allocating capital. By its very nature, trend following methodically shifts exposure to stronger performing asset classes and away from those experiencing weakness. In doing so, this process is designed to cut losses quickly and allow positive trends the room to persist. This loss-reducing mechanism is vital to long-term compounding.
Irving Kahn, who is a Benjamin Graham disciple and invested professionally for more than eight decades, put it this way: “Considering the downside is the single most important thing an investor must do.”
This is the basis for our allocation-based strategies, which are diversified across global asset classes and shift exposure from weaker to stronger assets based on price trends. Our track record and research provide considerable evidence of the wisdom in this approach when applied at the asset class level, due to its ability to improve risk-adjusted returns and help advisors reach client goals. But, as Housel reminds us, good ideas are one thing, executing on those ideas is entirely different.
Capitalizing on the Distribution of Equity Index Returns
The market’s movements in 2022 and thus far in 2023 serve as good examples of the conceptual efficacy of an approach centered on individual securities. Such a strategy can cut poor performers while holding tightly to leaders. This can have tremendous consequence in years like 2022 and 2023, when there’s heavy skew in the distribution of returns, as demonstrated in the graph below, which shows the distribution of 2022 and 2023 returns for each component of the SPDR S&P 500 ETF Trust (SPY).
SPY Constituents – Distribution of Returns
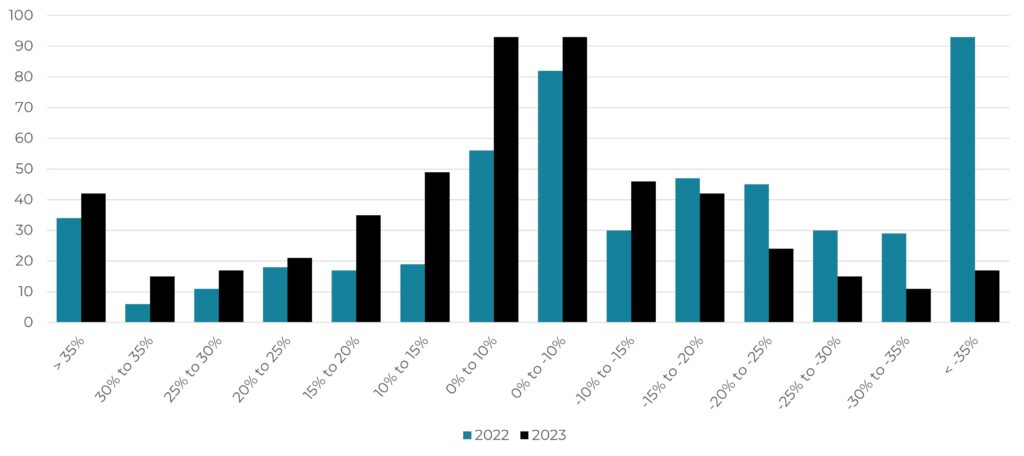
In a year like 2022, when the S&P 500 Index was down approximately 18%, you might expect the meat of the distribution to fall in negative territory. That assumption held true. However, it might be surprising to see that the highest frequency of stock returns fell in the < -35% bucket, as well as potentially shocking to learn more than 30 companies produced a return > 35%. Clearly this demonstrates an opportunity to be exploited by systematically moving away from outliers on the right side of the graph above and toward those on the left side.
The current year is visually different and more normal in its distribution than 2022, but the opportunities are just as apparent. When companies like Lumen Technologies (LUMN) and Signature Bank (SBNY) have become virtually or actually worthless, other stocks like NVIDIA (NVDA), Meta Platforms (META), and Tesla (TSLA) are enjoying an AI/tech-fueled rally. The result is almost the same number of stocks have produced a > 35% return (42) as those in the -10% to -15% or 10% to 15% buckets. One doesn’t even have to make aggressive allocations to improve their odds if they can consistently overweight the outperformers while underweighting the underperformers.
A Longer-Range View
The following table also illustrates the point, but over a longer time period.
You see that it is common for last year’s star sector is often the following year’s dog, and vice versa. For example, the energy sector has been either the bottom or top performer for four consecutive years.
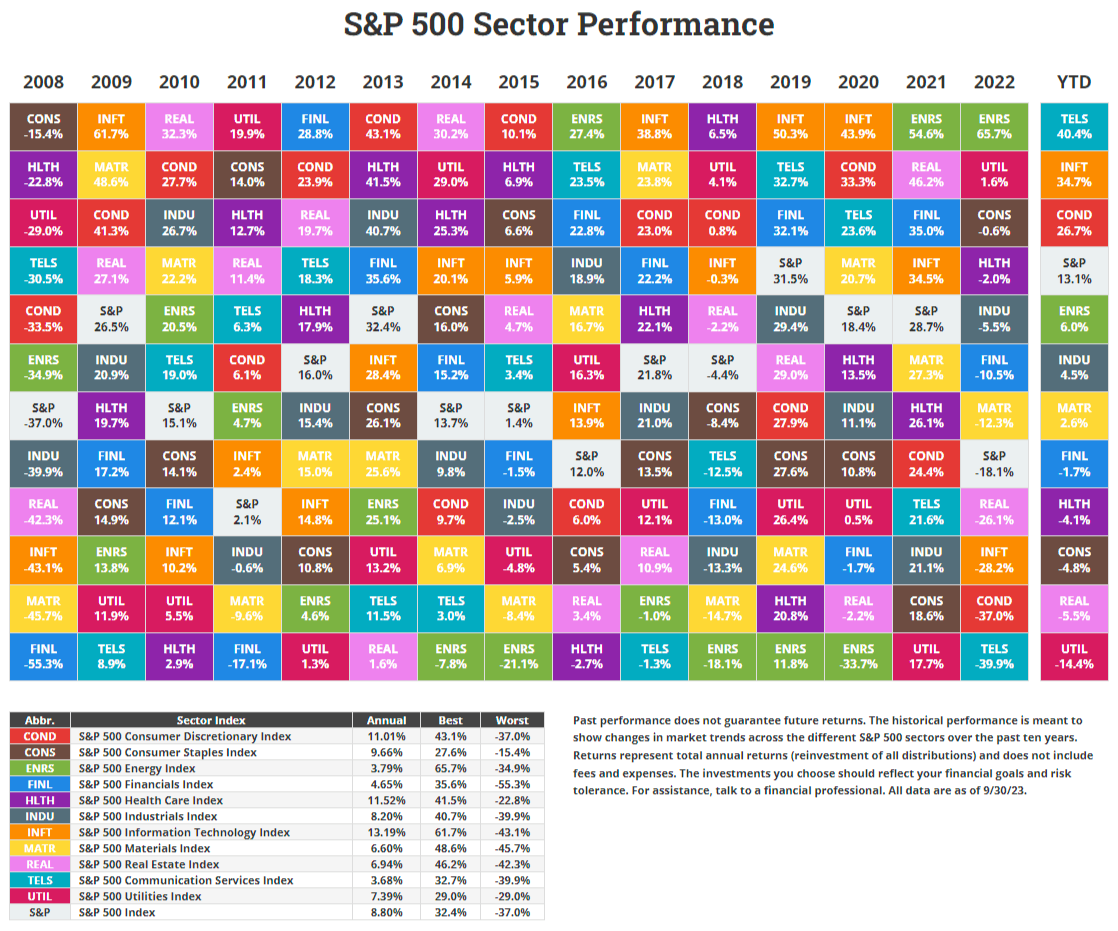 Source: novelinvestor.com
Using a trend following approach at the individual stock level accounts for distribution of returns in a way that an index cannot by remaining invested (or even increasing exposure) to stronger assets, while staying out of weaker components.
At this point, an astute advisor may ask, “Why not simply apply trend following to sector-based ETFs rather than individual stocks?” We concede this is an option, but view that approach as only going from the 10,000-foot level to 5,000 feet because it doesn’t account for potential distribution of returns within each sector. Said another way, it’s taking a hatchet to the problem, whereas unwrapping the index allows scalpel-level precision.
The result can be an even more enhanced experience in terms of returns and managing volatility for both the financial advisor and client.
Holding Individual Securities Creates More Opportunity to Harvest Losses for Tax Alpha
Under the current tax laws, trend following is an inherently tax-friendly approach to investing because it sells losses quickly and holds winning positions indefinitely if the trend doesn’t change. While the market will always rightfully dictate our firm’s exposure in a given year, during most environments our systematic investing processes will allow us to produce a tax-aware outcome because our systems are generally designed to produce tax alpha by harvesting short-term losses and maintaining exposure to winning positions.
Trend following at the index level wouldn’t allow for opportunities to harvest losses within the index constituents.
The value of a tax-loss harvesting strategy may be fresh in the minds of many financial advisors and investors right about now, as we move past the October tax filing deadline. For some, they are feeling the tax-time double-whammy of negative performance and a tax bill created by pre-2022-fueled paper gains becoming realized without an offsetting amount of loss harvesting. We have often written about the benefits trend following can provide in this arena.
Unwrapping the Index & Shining a Light on the ‘Black Box’
To wind down this topic, let me close by saying that unwrapping the index also fits well with the core value of transparency held by Blueprint Investment Partners. A big motivation behind the founding of our firm was our dissolution with the “black box” that surrounds many systematic investing models.
By applying our trend following discipline to individual stocks, it furthers our commitment to transparency.
Transparency breeds confidence in the way that “showing your work” did for your algebra teacher. It is one thing to say you have a great investment strategy, but a trustworthy manager need not fear showing why; our single-stock approach shows why at a very detailed level.

Let's Talk
If you'd like to further discuss our approach to trend following individual securities