Capitalizing On Distribution of Equity Index Returns
The market’s movements in 2020, 2022, and 2024 serve as good examples of the conceptual efficacy of an approach centered on individual securities. Such a strategy can cut poor performers while holding tightly to leaders. This can have tremendous consequence in years when there’s heavy skew in the distribution of returns, as demonstrated in the graph below, which shows the distribution of returns for each component of the SPDR S&P 500 ETF Trust (SPY).
SPY Constituents – Distribution of Return

Applying our systematic investing process at the individual stock level accounts for distribution of returns in a way that an index or ETF cannot.
2020 Case Study
While 2020 presented a wider than usual dispersion in annual returns, the historical distribution maintains a similar shape in that the index mostly consists of stocks that deliver close to the average return, but with significant outliers on both tails. For example, 2020 resulted in 54 stocks in the index delivering greater than 50% gains, while 42 stocks fell by 25% or more. The opportunity in 2020 rested in the fact that some sectors, like technology, performed excellently and were barely interrupted by the COVID-19 pandemic. Conversely, energy suffered coming into the crisis, and the negative performance was only exacerbated by the pandemic.
2022 Case Study
In a year like 2022, when the S&P 500 Index was down approximately 18%, you might expect the meat of the distribution to fall in negative territory. That assumption held true. However, it might be surprising to see that the highest frequency of stock returns fell in the < -35% bucket, as well as potentially shocking to learn more than 30 companies produced a return > 35%. Clearly this demonstrates an opportunity to be exploited by systematically moving away from outliers on the right side of the graph above and toward those on the left side.
2024 Case Study
The distribution of returns for 2024 was more right skewed, with more companies having a positive return than negative. Given the S&P Index's strong return, you would expect a plethora of well-performing stocks. Names like Palantir (PLTR) and NVIDA (NVDA) helped to drive the index, along with seven other stocks with triple-digit returns. Still, divergence existed, as 331 stocks recorded a positive return and 169 returned a negative return. Walgreens (WGA) and Intel (INTC) were among the worst-performers. The Blueprint Investment Partners systematic investing process leaned into well-performing companies and waited for laggards to resume positive price trends before re-engaging with their stock.
Longer-Range Perspective
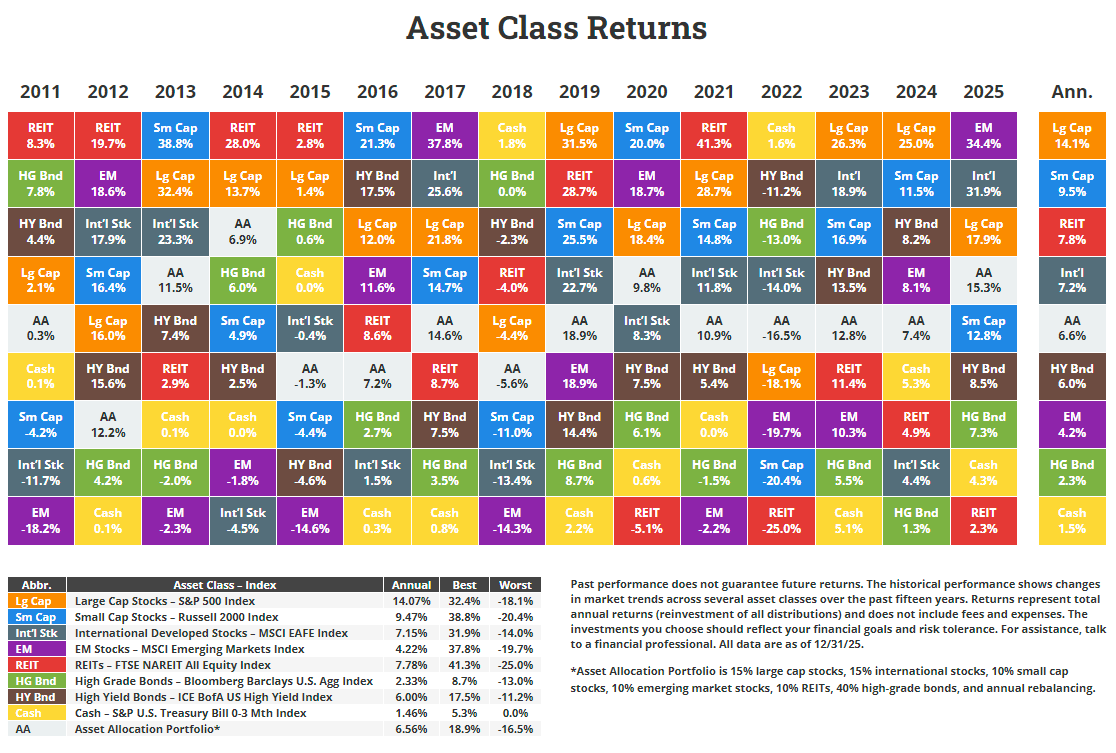
The following table also illustrates the point, but over a longer time period.
You see that it is common for last year’s star sector is often the following year’s dog, and vice versa. For example, the energy sector has been either the bottom or top performer for four consecutive years.
 Source: NovelInvestor.com
While the same effect could be accomplished by trading sector-based ETFs rather than individual stocks, it doesn’t account for potential distribution of returns within each sector. Said another way, trading sector ETFs would be like taking a hatchet to a problem, whereas unwrapping the index allows scalpel-like precision.
Let's Talk
If you’d like to learn more about how individual securities are used in Blueprint Investment Partners portfolios