Famous Strawmen: The Scarecrow & The Best 10 Days Rule

My mother has always been a big fan of Victor Fleming’s “The Wizard of Oz.” When I was a kid, it would be on TV at least once a year, and mom always made a point to watch it. I usually joined her…up until the part where the witch and her creepy troop of flying monkeys showed up. From there I would typically escape somewhere to avoid them, until they returned later that night to rule in my nightmares…
The characters are all memorable due to some of the basic themes they represent, but my favorite is Scarecrow. He values a brain over anything else and, in an ironic twist, he turns out to be the wisest of the group.
A recent running of the classic, combined with the collective enjoyment our team at Blueprint Investment Partners feels when slaying investment industry sacred cows, has me thinking about another famous strawman: the best 10 days rule.
Scarecrow, Meet Strawman (The Best 10 Days Rule)
Strawman Argument: an intentionally misrepresented proposition that is proposed because it is easier to defeat than an opponent’s real argument.
Besides Scarecrow, my other favorite strawman is an argument offered by those who believe that buy-and-hold is the best way to succeed in the financial markets. When discussing different approaches, such as dynamic allocation strategies, one will typically hear something like, “But, what about the best 10 days rule?”
For those who may not know, the best 10 days rule is the concept that missing just the 10 best days in the stock market dramatically reduces your long-term return. This is almost always used as a justification for staying fully invested in stocks regardless of the environment.
What makes it a strawman argument is that it leaves out critical information and misrepresents what an alternative approach might do instead. It also assumes that one would intentionally develop a strategy that misses only the best days in the market, which is ridiculous.
To further dig into the strawman nature of the argument by using data, I compared the impact of buying and holding the S&P 500 Index versus missing only the 10 best days. (Financial advisors can review the data.)
In my view, this test showed that what complicates the matter is that the argument is technically true – missing ONLY the top 10 BEST days did reduce return.
BUT, it is not the whole story of this strawman.
Volatility Goes Both Ways – Not Just Down
The tables below show the best 10 and worst 10 days since 1928.
Best & Worst Days Since 1928
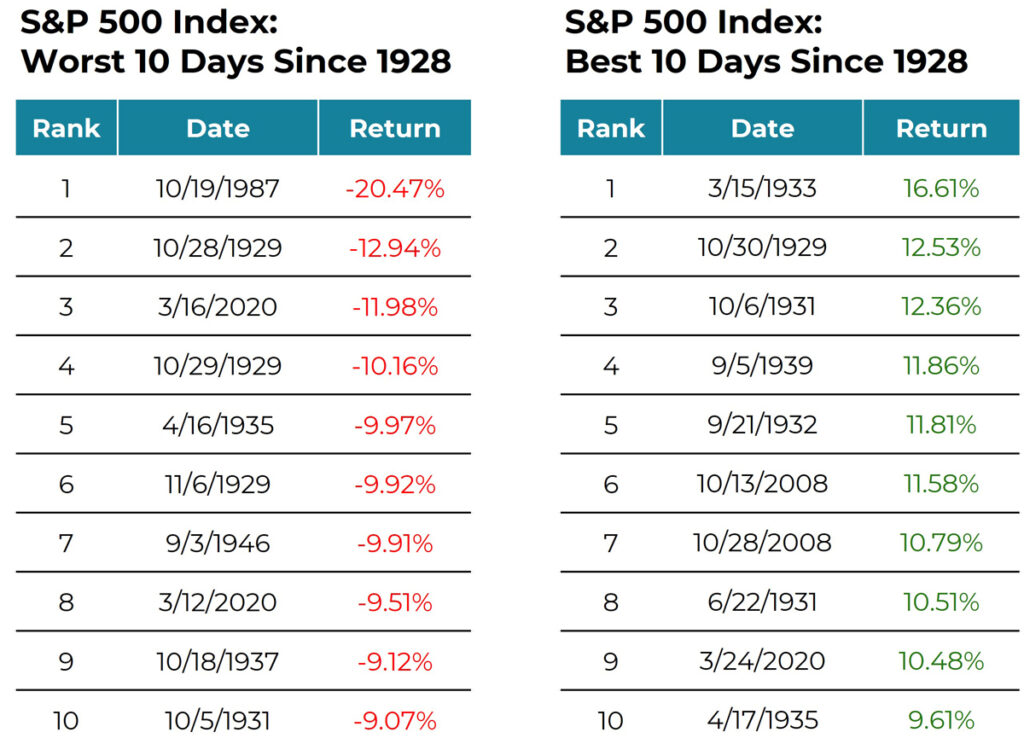
Astute readers will recognize something interesting about the timing of the best 10 days and worst 10 days. Many of the dates on the 10 best list occurred during not-so-favorable environments, during periods of instability and uncertainty.
In other words, volatility begets volatility.
What Matters Most? Best, Worst, Or Avoiding Both Extremes?
The next question a reader may ask is, “If volatility clusters, then what happens if you avoid both the best AND worst days? Further, is there a reliable way to do so?” My response is the same as Hans Landa in “Inglourious Basterds”: “That’s a bingo!”
I applied a simple trend-following strategy that sought to manage risk by buying (or holding) only when the average close of the last 10 days was above the average of the last 100 days, and selling when the inverse was true. (Financial advisors can review the data.)
In my view, the results showed:
- The trend-following approach would have avoided all 10 of the worst days since 1928
- You would have missed/sacrificed nine of the best days
According to the basic idea of the best 10 days rule, one might assume that performance of the trend-following strategy would be severely hindered because it captured just two of the best days.
This assumption was also scrutinized in my test.
I think the data shows that missing both provided a greater return than buy-and-hold – and with less volatility. This ratio leads to better risk-adjusted returns. It also likely would provide a better investor experience for clients, given the more palatable outcomes.
Moreover, being able to illustrate for clients how a simple, repeatable process aims to reduce exposure before the worst phase of a drawdown – and then can resume the exposure once volatility passes – can be a competitive advantage for goals-based advisors.
The Journey Affects Arrival at the Destination
“If anyone treads on my toes or sticks a pin into me, it doesn’t matter, for I can’t feel it. But I do not want people to call me a fool…”
Scarecrow
At first blush, the best 10 days rule is a compelling thought, but upon deeper inspection, it is a distraction from the importance of investor behavior.
Absolute returns are the destination, but the journey matters. Providing a more comfortable ride can give financial advisors an important moat in this increasingly competitive industry. More importantly, it helps your clients stay anchored to their financial plans during unprecedented periods in market history.

Let's Talk
If you have any questions about the data or how systematic investing can help manage risk in your client portfolios