Dissecting the 3 Stages Of a Bear Market

In a blog last week, I discussed how the virtually uninterrupted bull market in equities during the last 10+ years has watered down the idea of “downside protection.” This is a problem, especially since not all declines are created equal.
It has become apparent to the team at Blueprint Investment Partners that a more nuanced definition of downside protection is needed, one that recognizes three distinct stages of market declines. I provided an overview of those categories in last week’s blog, and in this follow-up post I’ll round out the definitions of each stage and highlight how our systematic investing process responds.
This following visual, which I also shared in the last blog, helps to put the three stages of a bear market into context by showing how each maps to the most recent major market drawdown:
Anatomy of a Bear Market
S&P 500 Index: July 2007 to March 2009
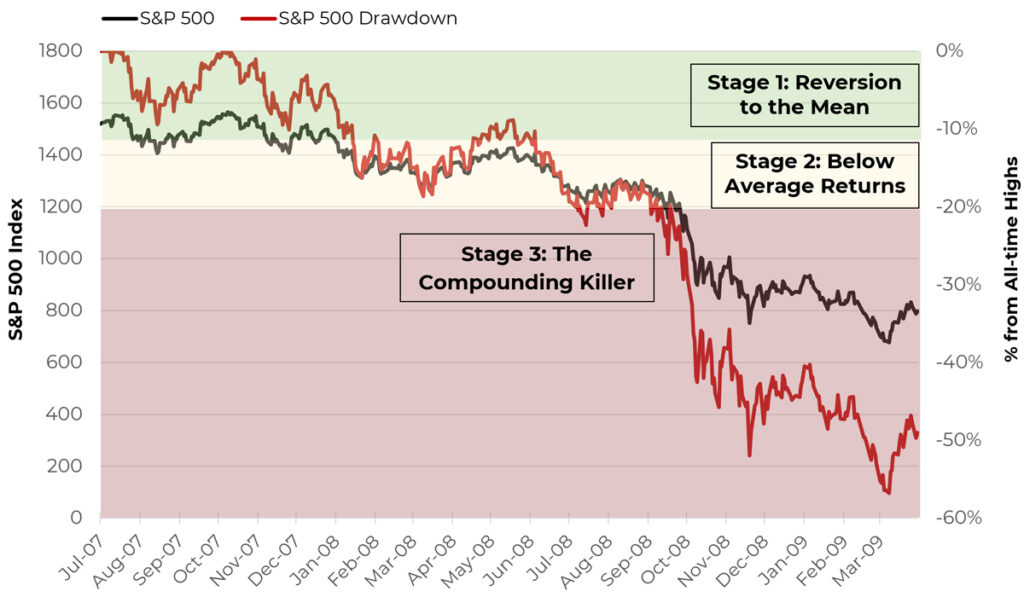
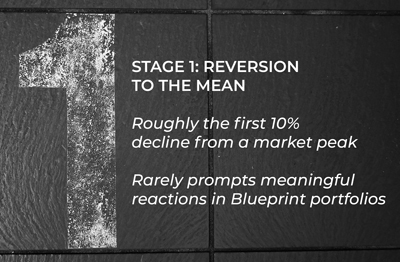
Stage 1: Reversion to the Mean (Little Action Required )
For a decline to occur, it must start from a peak.
Some peaks arrive after long expansions from the previous high. Others may be only a few basis points above a previous high. Either way, a decline from the peak represents the giving back of some or all value that was created. New highs necessarily mean a return above the recent average, so a decline back to that average is to be expected over the long-term.
In fact, when looking at the S&P 500 over the last 30 years, the average distance between an all-time high and the 200-day average close is a little more than 8%. Further, the compound annual growth rate of the 200-day average for the same period is more than 8%. Taken together, the average price of stocks alone is enough to meet most investors’ financial goals, and hence a decline to the average simply means a pause from above-average returns.
The severity of a stage 1 decline can vary depending on how far prices have advanced above average, but historically these declines are as high as 15% and as low as 3%. For simplicity, let us consider stage 1 to reflect the first 10% decline from a market peak.
It is our opinion, reversions to the mean are natural and even good for the long-term health of markets. After all, if NBA player Stephen Curry – who normally converts 3-point attempts at a rate of a 43% – suddenly goes on a run where he hits at 60%, then returns to a more “normal” 43%, the coach should not fret or bench him. It simply means that he has returned to average after a period of above-average performance.
Returns to the mean should be expected periodically.
Our systematic investing process is designed to mostly ignore stage 1 declines. In other words, we do not consider these declines to be material drawdowns that require meaningful downside protection. While sometimes emotionally tempting, overreacting to these by looking to exit the market brings with it the high likelihood that one will not fully capitalize on favorable trends in equities, which has far worse impacts to compounding than sitting through a measly 10% decline. In addition, reallocating during a stage 1 decline frequently creates short-term capital gains, which can further penalize long-term after-tax performance.
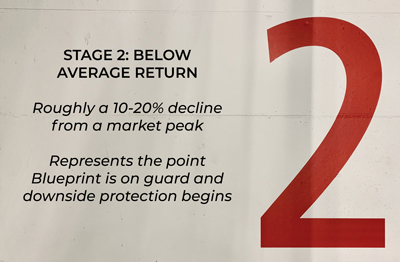
Stage 2: Below Average Returns (Point of Maximum Opportunity for Action)
Whereas stage 1 declines are normal, should be expected, and often can be ignored (sometimes they even should be celebrated), that’s not so with stage 2. In almost all client portfolios, stage 2 declines represent the earliest point where financial advisors should be on guard and downside protection should begin.
This is where careful timing and disciplined decision-making can have long-term consequences on compounding and the achievement of client goals.
Our research indicates that volatility and declines typically accelerate and cluster from here, so if a portfolio can be reallocated in a disciplined and repeatable way, then it can usually consistently capture the bulk of upside opportunity while smoothing out the downside risk.
For our purposes, we consider this stage to be the next 10% in decline from an all-time high. Thus, we are talking about drawdowns in the 10-20% range.
Blueprint Investment Partners strategies are designed to execute in this stage. Our portfolios are reallocated using two timeframe systems, and the rules for our most reactive system (the intermediate-term timeframe) is meant to take action at the top of this stage. Conversely, our longer-term system typically reacts closer to the middle and bottom of this stage. Segmenting our rules into two timeframes allows us to smooth entries and exits, even in the most tactical of our strategies.
Our goal is to finish making adjustments in this stage so we avoid the truly devastating impacts of stage 3.
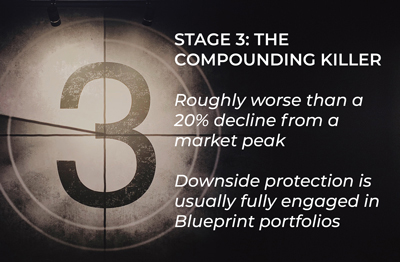
Stage 3: The Compounding Killer (Protect Capital by Being Out of the Market)
If stage 2 is the first meaningful environment for downside protection, then stage 3 represents where the real damage to portfolios can occur in a portfolio that’s lacking risk management. At this stage, downside protection should already be fully engaged, in our view.
We consider this to be declines of 20% or more from a previous peak, which coincidentally is the mainstream definition of a bear market.
Our goal, depending on how fast the decline occurs, is to be defensively postured in a market that has fallen past 20-25%. Once that drop has occurred and the averages begin to stabilize, we may quickly re-enter, but we want to have already exited once it reaches stage 3.
In our view, stage 3 declines are like being out after midnight…nothing good happens. Sure, one can step in and get lucky enough to catch a bottom, but more times than not this ends badly. Plus, this stage is when the flight response can kick in for many clients and, without a disciplined plan to re-enter, where their compounding can be permanently impaired.
Stage 3 is potentially the largest of the three; whereas the others are 10-15% bands, in theory a stage 3 decline could go to -100%. Few investors have the conviction to stick with an investment once it has fallen more than 50%, assuming it is a meaningful portion of the portfolio. The data tells us that the flight response is extremely damaging, and yet predictable.
Bringing It All Together
Hopefully the exercise of segmenting declines into their three stages has provided some perspective on when advisors and their clients should be on alert and when they shouldn’t. I also hope this has provided some context on what Blueprint Investment Partners means by “downside protection.” Advisors expecting us to act in stage 1 have misunderstood what our research has concluded and how our process works. Stage 2 is where the magic happens, so that by stage 3 we are wrapping up any actions or have already completed them well in advance.
If all this sounds simple, it’s because it is designed to be that way. Simple rules are hard enough to execute consistently. It’s like the five ascending levels of intellect Einstein talked about: smart, intelligent, brilliant, genius, and final – simple.

Let's Talk
If you'd like to learn more about Blueprint's simple yet sophisticated rules