What 200+ Years of Data Teaches About Market Concentration

With markets at or near all-time highs for most of 2024, we are consistently asked questions about valuation, market divergences, and other factors that may portend the end of the bull market. One of the most pervasive questions lately has been about market concentration. As a fewer number of stocks continue to dominate markets and indexes, we think it is important to answer these questions with data.
The market this year has been dominated by the “Magnificent Seven” stocks: Apple, Microsoft, Alphabet, Amazon, NVIDIA, Meta, and Tesla. These tech giants have captured an outsized share of market returns.
But is this unprecedented?
Global Financial Data released a report on this subject earlier this year, which looks at U.S. stock market data since 1790, a whopping 235 years. As their graph below shows, market concentration is not new. The combined market cap of the largest single company, largest five companies, and largest 10 companies has historically been high.
Percent of Total Market Cap Share of Largest 1, 5, and 10 Companies in the U.S., 1790 to 2023
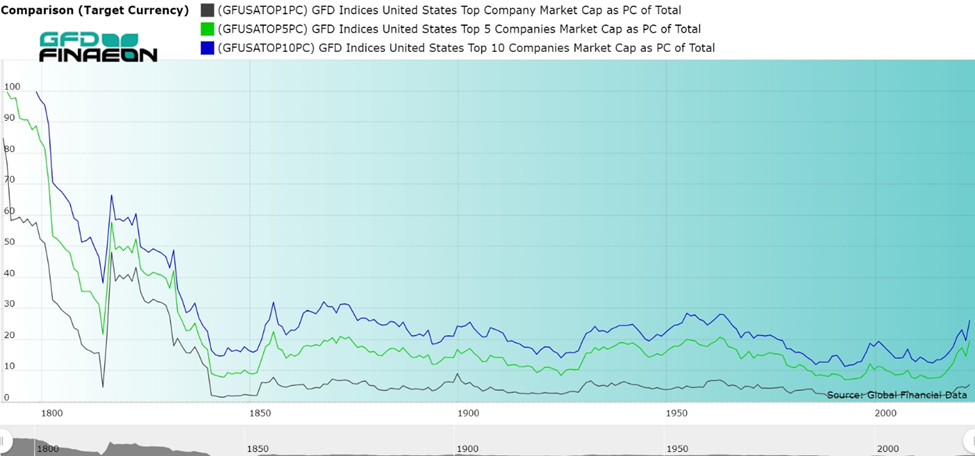
In short, the data shows that market concentration is a recurring theme. Technological advancements, economic policies, societal shifts, and market changes have continually influenced some sectors and companies to be propelled into dominance. And while recency bias may make it feel like market concentration has been heating up, when we take the long-term view, we see there actually has been a decrease during the past 200 years, as the supply of stocks has increased.
Historical Market Concentration: Key Periods
To understand the current state of market concentration, I think it is helpful to explore how it has evolved over the past 200+ years. By examining these distinct historical periods, we can observe the recurring themes and drivers of concentration. This context helps us understand that today’s market concentration is not an anomaly but part of a long-standing trend.
Global Financial Data’s report breaks down U.S. market concentration into seven distinct periods:
1790-1840: The Bank of the United States Dominates
1840-1875: The Rise of the Railroads
1875-1929: The American Commercial Revolution
1929-1964: The First Magnificent Seven
1964-1993: Free Trade and Global Expansion
1993-2014: The Rise and Fall of the Stock Market
2014-Present: Technology Stocks Take Over
 1840-1875: The Rise of the Railroads
Macro environment: The railroad industry was expanding and became the backbone of American industrial growth, facilitating commerce and westward expansion. Companies like Pennsylvania Railroad and Union Pacific became household names, dominated the market, and drove economic development.
Concentration: The 10 largest companies represented 20% of the stock market in 1853. This held true for most years until 1911.
 1929-1964: The First Magnificent Seven
Macro environment: The period from the Great Depression through the post-World War II boom saw shifts in market concentration. On the one hand, there was a wave of failed and merged companies due to the stock market crash of 1929 and subsequent economic downturn. On the other hand, new industrial leaders rose during the post-war economic expansion.
Concentration: The “OG” Magnificent Seven was born, with AT&T, General Motors, IBM, Standard Oil, General Electric, du Pont, and U.S. Steel dominating during the 1930s-50s. These seven remained among the 10 largest companies during most of those three decades.
 1993-2014: The Rise and Fall of the Stock Market
Macro environment: The advent of the internet and technological advancements during the 1990s and early 2000s led to the dot-com boom and bust. The bubble burst in 2000 and the financial crisis of 2008 led to significant market volatility and shifts in concentration.
Concentration: Around 1993, concentration in the U.S. market was at the lowest level in history – but the period from 1993 to 2014 represented a reversal, ushering in a large increase in the concentration of stocks. Although concentration persisted, the constituents of it ebbed and flowed. For example, the tech boom resulted in a small number of related companies moving into the top-10 list, including Microsoft, IBM, Intel, and Cisco Systems. However, by 2008, Microsoft was the only company that remained in that group. Pfizer and Merck are pharma names that were often in the top 10. Apple joined in 2009, and by 2012 it was the largest corporation in the world.
 2014-Present: Technology Stocks Take Over
Macro environment: The current era is dominated by technology giants. These companies have leveraged network effects, big data, and innovative technologies to establish dominant market positions. Their influence extends beyond traditional sectors, impacting virtually every aspect of modern life.
Concentration: Concentration in the U.S. stock market has increased remarkably during the past decade: the top 10 stocks in the S&P 500 made up about 16% of the total index in 2014 but now is more than 30%. In 2014, there were only two technology stocks in the top 10. Today the number has quadrupled to eight of the top 10. The biggest five account for about 26% of the total market capitalization of the S&P 500. The only two non-tech stocks are Berkshire Hathaway, which has about 29% of its portfolio in Apple stock, and Eli Lilly, a biotech company.
Systematic Investing: Navigating Market Concentration & Adapting to Market Leaders
At a high level, the Global Financial Data study shows that market concentration increases during a bull market and decreases during a bear. This suggests a natural correction mechanism, where the market redistributes wealth when it becomes too concentrated.
However, given the relative recency of the market’s current build up in concentration, the Global Financial Data analysis does not foretell impending doom:
“It has only been since 2014 that concentration has increased dramatically. This would lead us to believe that even when the next bear market occurs and concentration is reduced, not all of the increased concentration will be eliminated. The overall trend may be for growth and greater concentration for years to come.”
That reads a lot like a prediction to me, albeit one that is based on a robust dataset.
At Blueprint Investment Partners, we’re hardwired to avoid basing our investing decisions on predictions. Instead, we prefer to apply an investment methodology that seeks to participate in the upside during concentrated markets while having a systematic exit strategy for the eventual reversals.
The Global Financial Data study reinforces our conviction in our systematic, trend-following approach to investing.
Using the price of an asset as the primary variable, we adjust positions based on predefined rules. The goal of this approach is to capture gains during uptrends and preserve capital when there are downtrends. By focusing on price trends rather than attempting to predict market movements, we can remain disciplined and avoid emotional decision-making.
Trend following’s ability to help regulate emotions strikes me as particularly important right now, when it seems like everyone and their brother is talking about how only a few stocks are accounting for most of the market’s gains. This can lead investors to feel anxious about missing out and equally anxious about a potential bubble burst.
As the Global Financial Data study demonstrates, market concentration is normal and cyclical, though leadership in the market changes over time. The Magnificent Seven of today might not be the leaders of tomorrow, but our trend-following strategies are designed to adapt, allowing for a natural rotation into new market frontrunners. This approach aims to help us avoid overexposure, including the potential ego trap of sticking with yesterday’s winners. It also helps to position us for future opportunities while managing the risk of the current portfolio.
As we navigate the current era of market concentration, our systematic investing process is allowing us to live by a mantra of, “Embrace it, but remain vigilant.”
Sourcing: Morningstar.com, SPDR® S&P 500® ETF Trust SPY, 10/14/2024 and Cnbc.com, Berkshire Hathaway Portfolio Tracker, 10/14/2024

Let's Talk
If any of this resonates with you