Stocks ‘On Sale’? Or About to Go ‘On Final Clearance’?

During market drawdowns, you often hear financial services media types talking about stocks being on sale.
This phrase has always irked me.
I think it’s completely imprecise and utterly useless. Clichés may help sell airtime, but in my opinion they get you nowhere toward designing or implementing a comprehensive investment process.
Instead of leaning on trite phrases, wouldn’t it be a lot less stressful to have an investing process that can help both smooth out the ride and generate a more optimal client experience?
2022 Has Entered the Chat
I believe too many investors (including financial advisors) prioritize short-term return over long-term process. For instance, those who do likely spent 2020 and 2021 zigging, then zagging. Zigging, then zagging.
Enter 2022.
The year began almost immediately with concerns about inflation and rising rates, which weighed on equities. In late January and early February, the market seemed to be calming. That was until tensions between Ukraine and Russia escalated and quick-punched volatility back into the market.
We’ve seen this process repeat – with risk on, then risk off – several times this year. Thus far, equities have been unable to hold a sustained rally to new highs.
I believe that those who have continued to hunt for returns in a haphazard way likely vastly underperformed, as it would have been a serious challenge to keep up with the swinging pendulum. Here are just a few examples:
2020
Growth and tech stocks dominated U.S. equities
U.S. government bonds performed well
Value and dividend stocks suffered significant drawdowns and dramatically underperformed their growth counterparts
2021
Growth and tech stocks were near the bottom, with some indexes negative for the year
U.S. government bonds were in a bear market
Value and dividend stocks became leaders and produced strong returns
2022
Growth and tech stocks have experienced a 30%+ drawdown and significant volatility
U.S. government bonds remain in a bear market and have had their worst start to a year in nearly 40 years
Value and dividend stocks, especially those in the energy sector, have continued to hold up much better than growth-oriented stocks”
Prioritizing Process
Please don’t misunderstand me; it’s not that I think pursuing return is bad. After all, isn’t that the whole point of investing?!
Where I think the “bad thing” comes in is when investors chase returns without a concrete plan.
Personally, I think there’s tremendous value in having a plan for all types of environments, regardless of the current state of the market. Pre-determining how you will react to a future event can not only remove biases from your decision-making, but also can give you the freedom to enjoy conditions in the present.
Systematic investing is a common way to achieve this level of pre-determination of future actions. And while many asset managers – TOO MANY asset managers, in my view – like to position their systematic investing strategies as super sophisticated and proprietary, I believe the “black box” sometimes has more to do with ego and justifying fees than anything else.
More specifically, Blueprint Investment Partners has found that a trend-following processes can be built so that it’s rules-based, adaptable, transparent, and something financial advisors can explain to their clients in plain English.
Robust trend-following strategies often will invest in all the major global asset class and make allocation adjustments based on the intermediate- and long-term trends taking place in each class.
I think the argument for taking this systematic, yet asset-class-agnostic approach was strengthened by the market disparities between 2020 and 2021. And I think the value of systematic investing has been reinforced further in 2022.
- In 2020, you may have received an overall portfolio return below the long-term average unless you were disproportionately invested in very specific sectors or factors
- In 2021, this was again true, but with an almost completely opposite set of holdings
- In 2022, there’s been a reversal pretty much everywhere, with the downturn in growth, high beta, and fixed income being particularly noteworthy
In all three years, our analysis indicates you likely had a smoother ride if you used a systematic investing process to assist with allocation decisions.
Systematic Investing Aims to Win More By Losing Less
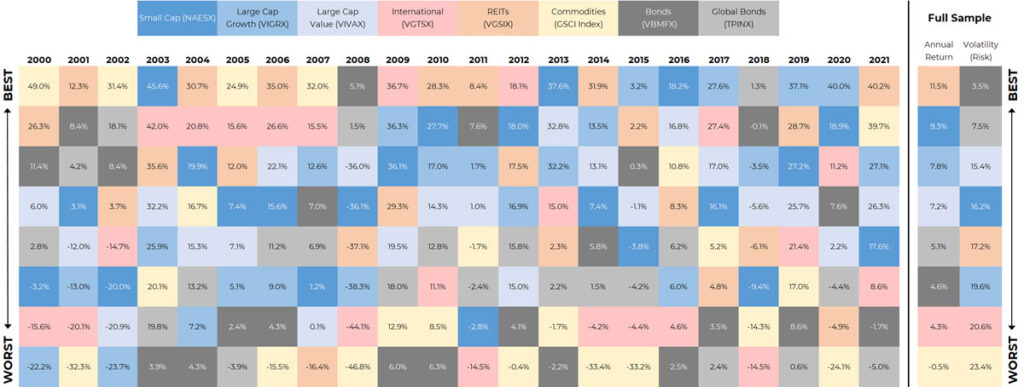
Many financial advisors are familiar with the periodic table of asset class performance like the image below, which is a popular tool for illustrating the importance of diversification to clients.
Borrowing from chemistry, it shows calendar years from left to right, with individual asset classes lined up under each year in descending order of their performance. The main point is to show that any asset class can vary widely from one year to the next, going from a top performer to one of the worst. Thus, it makes a case for portfolio diversification.
Global Asset Class Annual Returns (2000-2021)
To help financial advisors visualize the impact of diversification across both asset classes and time, Blueprint Investment Partners has taken the periodic table concept a step further by adding:
- A buy-and-hold diversified portfolio to show the impact of asset class diversification
- A trend-followed diversified portfolio to illustrate the effect of asset class diversification and time diversification
Financial advisors can review the Blueprint Investment Partners periodic table table for themselves.
What jumps out to me when I look at the Blueprint Investment Partners periodic table is how using the trend-following approach provided what looks to me like a more stable progression through the table. Returns were only occasionally near the top, but also (and perhaps more importantly) they were rarely near the bottom. The second point is a testament to the ability of systematic investing to help provide some downside protection, in my view. We believe the final result over the full sample is a more equity-like return profile, but more bond-like risk/volatility behavior.
I think 2020, 2021, and so far in 2022 present excellent examples of why this is important. I believe if you chase returns or try to buy stocks when they are supposedly on sale, you may actually find yourself catching a falling knife. The alternative is an approach that can offer a consistent, steady process – as well as a more consistent, steady result. It isn’t married to any one asset class or factor, but it is unwaveringly rooted in a philosophy of being systematic as a means of adapting to whatever sets of facts dominate the market.

Let's Talk
If this is a topic you’d like to discuss further