What Investors Think Should Happen Versus What Is Actually Going On
November 30, 2023
The plural of anecdote is not data.
—Roger Brinner
As systematic trend followers, we make decisions using price data. It appears to us that many in the investment world take a different approach, instead viewing markets through a lens of stories and anecdotes. In times like now, the second approach can present a communication challenge if current market dynamics don’t fit with the story that’s being told. Presently, there’s a notable sense of disbelief, as both stocks and bond prices are on an upward trend.
Investors often have preconceived notions about market behavior that are based on economic fundamentals, historical data, or personal experiences. When the market moves in ways that contradict their beliefs – such as the market continuing to rise despite signals of overvaluation or perceived economic downturns – it creates a sense of disbelief. This results from disharmony between what investors think should happen and what is actually going on, which introduces noise to decision-making and risk management.
Trend followers don’t have to wrestle with tension between what is empirically happening in the markets versus what they believe should be going on because, in contrast, they maintain an objective stance that allows data to direct their decisions. This data-centric approach is crucial, in our view, to effectively navigating the market. And it’s particularly valuable during volatile or irrational conditions because it allows you to remain focused on actual trends rather than be swayed by personal beliefs or prevailing market sentiments.
In this month’s Co-Founders’ Note, we discuss the erratic swings in investor sentiment reflected in the movements of the S&P 500 this year. We also examine historical S&P 500 data, focusing on time to recovery to provide context for the last 24 months.
But first, here’s a summary of our take on what transpired in the markets in November.
Asset-Level Overview: Market Talking Points for Financial Advisors
Equities & Real Estate
The U.S. equity markets opened November with five consecutive positive days, joining the final two days of October to create a string of seven straight. The seven-day surge of more than 6% in the Vanguard Total Stock Market Index was followed by a brief two-day pause, before continuing to increase, with the month likely to close around 9%. Overall, U.S. equities seemingly turned on a dime from the October lows on the 27th, increasing more than 10% after retesting the previous highs from the second quarter of 2023.
Not only was the November rally sharp, but it was also broad. Almost all equity segments participated, from small to large and foreign to domestic. Growth and tech continue to lead, with dividend and value lagging on a relative basis. Even the real estate sector, which has been the dog of equity and quasi-equity indexes, performed well in November.
The result of all these increases was a flood of intermediate-term uptrends returning in the portfolios. These uptrends mean increased exposure to all the segments noted above. Importantly, only large caps, growth, and tech will be overweight, as they have been for much of the year. The other segments will increase but remain below their baseline allocations until they are able to substantiate their moves more definitively.
Fixed Income & Alts
Fixed income also recovered in November. Continued news indicating a peak in rate hikes by the Fed resulted in more support for bond prices. The iShares Core U.S. Aggregate Bond ETF is on the verge of its first intermediate-term uptrend since May, which means instruments with duration, whether international or domestic, are looking at the first meaningful increases in our portfolios since the first quarter.
The result is that Blueprint Investment Partners portfolios will again attempt to increase duration to take advantage of burgeoning uptrends in fixed income. If these moves fail, like they have previously during the last couple of years, then we will harvest losses and return to the short end of the yield curve. However, there is a reasonable expectation that eventually the returns from longer-duration instruments will present promising opportunities for patient systematic investing strategies.
After a mid-month retest of its recent average price, gold increased during the latter half of November, maintaining its uptrends as we enter December. The result is that exposure will not change and remains at its baseline allocation.
Sourcing for this section: Barchart.com, Total Stock Market ETF Vanguard (VTI), 10/1/2023 to 11/28/2023; Barchart.com, Growth ETF Vanguard (VUG), 11/1/2023 to 11/28/2023; Barchart.com, S&P 500 Technology Sector SPDR (XLK), 11/1/2023 to 11/28/2023; Barchart.com, Value ETF Vanguard (VTV), 11/1/2023 to 11/28/2023; and Barchart.com, High Dividend Yield Vanguard ETF (VYM), 11/1/2023 to 11/28/2023
3 Potential Catalysts for Trend Changes: Giving Clients the Context
More Supply: Federal Reserve Chair Jerome Powell signaled an interesting shift when he stated the central bank did not have to worry about stronger growth feeding more inflation. He noted that the economy’s speed limit, known as potential growth, appears to have temporarily moved up thanks to more inventories, more people available to work, and possibly more worker productivity. While growth has likely stepped down in the current quarter, it remains healthy. Concurrently, inflation and wage growth have continued to slow.
Home No-Sales: Sales of previously owned homes fell a seasonally adjusted 4.1% in October from September, a major contributor to a fresh 13-year low for all home sales. High home prices and elevated mortgage rates have pushed many would-be buyers out of the market. Even as home-buying demand has declined, the inventory of homes for sale has also stayed low because high rates are making homeowners unwilling to sell and move. The limited supply is a major driver for why home prices are continuing to rise in much of the U.S.
Warning Signal: Economists have pulled back their recession forecasts, businesses are hiring, consumers are spending, and output is growing – however, one popular indicator is still sending up a warning signal. The Conference Board’s Leading Economic Index (LEI) fell 0.8% in October, its 19th straight decline. The LEI aggregates a broad array of indicators, such as jobless claims, building permits, and interest rate spread. “The Conference Board expects elevated inflation, high-interest rates, and contracting consumer spending to tip the U.S. economy into a very short recession,” said a Senior Manager at The Conference Board.
Sourcing for this section: The Wall Street Journal, “Home Sales Fell to a New 13-Year Low in October,” 11/21/2023 and The Conference Board, “LEI for the U.S. Declines Again in October,” 11/20/2023
What The Data Shows About Time to Recovery
Without data, you're just another person with an opinion.
—W. Edwards Deming
In last month’s Note we highlighted the absurd swings in investor sentiment experienced in 2023. Right on cue, equity markets experienced another reversal, surging higher. As we write this Note, the S&P 500 Index sits around 4550 and is nearing a new all-time high (ATH), off by just about 6% as we approach the end of 2023.
The S&P 500 made its last intra-day high January 4, 2022, at 4818.62. It surpassed correction territory of a 10% decline in April 2022 and the bear market designation of a 20% decline by the end of June 2022. In October 2022, it hit the trough of the move (so far), falling more than 27% from the January high.
Since then, more than a year has passed, with more than 30% regained. As we try to sum up this year and begin thinking about 2024, it motivated us to look at previous corrections and how long it has taken the S&P to recover. Perhaps we can glean some lessons from this data to frame our mindset for 2024.
Using the SPY ETF since its inception in 1993, we found that the average months from 10% drawdown to new ATH is approximately 28 months. However, with only six instances of this occurring since 1993, the sample size is likely too small for robust conclusions. To gain a more comprehensive understanding, we looked further back by utilizing nearly 100 years of S&P 500 Index data, where we found a similar average recovery time of 28 months.
Time to Recovery
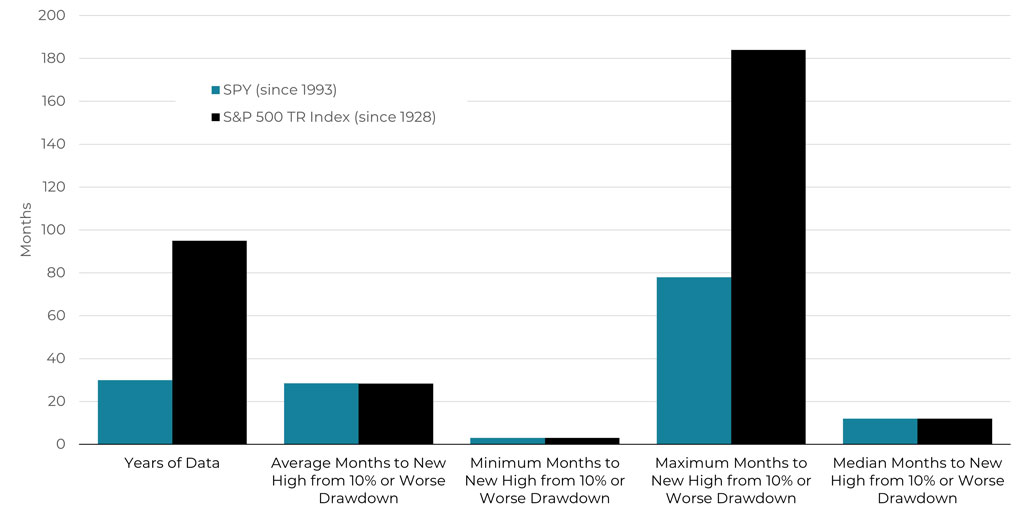
Source: ICE, 2/1/1993 to 11/1/2023 and GFD, 10/1/1928 to 11/1/2023
As one might expect, very long bear markets in the 1920s, 1930s, and 2000s skewed the distribution to the right and the average upwards. With that in mind, we looked at the median recovery time, which is 12 months over the nearly 100-year sample. In other words, the S&P 500 historically typically takes about one year to fully recover from drawdowns of 10% or more.
As we end November, the S&P 500 Index has spent 20 months underwater. Compared to the historical data, we are well past the typical (median) recovery time and nearing the positively skewed average. While one should be wary of predictions about what happens next, there is a statistical case to be made for being invested in equity markets in anticipation of the current bear market’s end and new bull market forming.
For us, this is not about predicting what could happen. Rather, we want to point out the potential value of a systematic investing process. In what has been an unfriendly environment for some trend-based systems since October 2022, our strategies have generated returns consistent with most investors’ long-term goals while staying within our strict risk-management guidelines. Our strategies are increasing equity exposure at a time when equity markets could be readying for a new ATH.
In times like now, when investor sentiment is shifting rapidly and monetary and fiscal policies are at inflection points, it may feel like there have never been more plates for a financial advisor to keep spinning. We value the opportunity to support advisors by providing strategies you can count on to keep your clients well positioned, information you can use to keep clients calm and confident, and service that consistently meets and raises your expectations. We are working hard to finish strong in 2023 and look forward to helping our partnering advisors finish strong as well.
Sourcing for this section: Barchart.com, S&P 500 Index ($SPX), 10/1/2021 to 11/28/2023; ICE, S&P 500 SPDR (SPY), 2/1/1993 to 11/1/2023; and GFD, S&P 500 TR Index, 10/1/1928 to 11/1/2023
Best regards,


Jump To: Asset Allocation Update
View Archive: Co-Founders' Monthly Notes
Let's Talk
If you’d like to learn more about Blueprint's repeatable and disciplined application of a systematic investing process