Shouldn’t We Be Enjoying this Ride?
March 28, 2024
Life is what happens to us while we are making other plans.
—Allen Saunders
In our recent discussions with financial advisors, we’ve often encouraged them to enjoy this environment, especially when conversations veer toward pessimism. We’ve heard phrases like, “This can’t continue,” or, “How much longer can this go?” As humans, this feeling is understandable, but isn’t always particularly rational.
We’ve observed that, whether in bull or bear markets, worry seems to be the prevailing sentiment among investors. This constant state of anxiety persists regardless of market conditions. The year 2022, with its high volatility and disrupted trends, was understandably a cause for concern. However, with the S&P 500 on the brink of recording one of its best first-quarter performances since 1928, the question arises: Should we be enjoying the ride?
In our view, the common anxiety despite exceptional market performance illustrates the importance of systematic investing. This disciplined, rules-based approach not only seeks to protect against market sentiment, but also promotes emotional detachment among investors. By reducing the sway of fear and euphoria, a systematic investing process keeps focus on long-term goals so that decisions are driven by strategy, not emotion.
In this month’s Co-Founders’ Note, we examine the S&P 500’s Q1 performance, comparing it with first quarters back to 1928. We also review how the S&P 500 fared in Q2-Q4 during years when the first quarter was notably positive. Our goal isn’t to predict the future but to highlight the strength and durability of trend following.
But first, here’s a summary of our take on what transpired in the markets in March.
Sourcing for this section: ICE, S&P 500 TR, 10/1/1928 to 3/25/2024
Asset-Level Overview: Market Talking Points for Financial Advisors
Equities & Real Estate
Another month, another all-time high for the S&P 500 Index in 2024. As the holiday-shortened trading week comes to a close, U.S. markets are on pace to continue a run of five positive months.
In terms of market dynamics, growth stocks have led the rally year-to-date, but it’s interesting to note that value, dividend, mid-, and small-cap stocks have outperformed growth in March. As trend followers, our focus isn’t on the U.S. market’s breadth or the question of which asset is leading or lagging. We often encounter discussions about the role market breadth plays in assessing market “health,” but we do not use it as a direct factor in portfolio management. Instead, we view market breadth as inherently reflected in the price trends of the assets we trade. Therefore, based on the current price trends, Blueprint Investment Partners portfolios will not change their U.S. equities allocations and will remain overweight.
Perhaps not surprisingly given the value bent, foreign developed markets have also performed relatively well in March, leading the S&P slightly as the month winds down. Emerging markets are also positive but continue to lag many of the other indexes. Overall, international stocks continue to be underweight in our portfolios, with a tilt toward developed equities.
As is typical, sentiment around interest rates continues to drive real estate security prices. Prices are generally unchanged for the month, but trends remain positive. The overall picture for the asset class in our portfolios remains unchanged as we head into April.
Fixed Income & Alts
Like real estate, fixed income investors continue to wait with bated breath for economic results around inflation and employment, while also listening closely for cues from the Federal Reserve. Data shows inflation to be stubbornly elevated, but the Fed appears content with its plan for rate cuts this year. Prices have yo-yo’d accordingly. Perhaps as expected, trends remain mixed, with ultra-short-term Treasuries remaining the strongest in terms of price, while also having some of the strongest yields. For that reason, Blueprint Investment Partners portfolios will remain overweight on the very short end of duration and completely out of longer-duration instruments. Any intermediate-term exposure is small and under seven years.
Gold is currently one of the best-performing assets for March. Not surprisingly, trends continue to be positive as the month ends. As a result, exposure in our portfolios will not change and will remain at its baseline allocation.
Sourcing for this section: Barchart.com, S&P 500 Index ($SPX), 10/1/1928 to 3/25/2024; Barchart.com, Growth ETF Vanguard (VUG), 3/1/2024 to 3/25/2024; Barchart.com, Value ETF Vanguard (VTV), 3/1/2024 to 3/25/2024; Barchart.com, High Dividend Yield Vanguard ETF (VYM), 3/1/2024 to 3/25/2024; Barchart.com, Midcap ETF Vanguard (VO), 3/1/2024 to 3/25/2024; Barchart.com, Smallcap ETF Vanguard (VB), 3/1/2024 to 3/25/2024; Barchart.com, FTSE All-World Ex-US ETF Vanguard (VEU), 3/1/2024 to 3/25/2024; Barchart.com, 1-3 Month T-Bill Barclays Capital SPDR (BIL), 3/1/2024 to 3/25/2024; Barchart.com, 1-3 Year Treasury Bond Ishares ETF (SHY), 3/1/2024 to 3/25/2024; Barchart.com, 3-7 Year Treas Bond Ishares ETF (IEI), 3/1/2024 to 3/25/2024; Barchart.com, 20+ Year Treas Bond Ishares ETF (TLT), 3/1/2024 to 3/25/2024; and Barchart.com, Gold Trust Ishares (IAU), 3/1/2024 to 3/25/2024
3 Potential Catalysts for Trend Changes: Giving Clients the Context
No Surprise: As expected, the Federal Reserve held interest rates steady at its policy meeting that concluded March 20, but officials still expect three rate cuts in 2024. Firmer-than-expected inflation in the first months of the year hasn’t derailed the central bank’s plans, but a stronger-than-expected growth environment has raised policymakers’ outlook for longer-term rates. Fed officials now forecast fewer rate cuts in 2025 and 2026. The longer-term “neutral” rate needed to keep the economy at full strength with steady inflation is now expected to be 2.6%, up slightly from 2.5% in December.
No More Negatives: The nearly 12-year global experiment with negative interest rates is over. The Bank of Japan, the last holdout, has moved its key policy rate back to at least zero. The experiment revealed that negative rates weren’t enough by themselves to pull economies out of a recession or lift inflation toward the central banks’ 2% targets. A global pandemic and the start of the war in Ukraine pulled forward spending and caused shortages, which increased inflation. In Japan’s negative-rates case, after a delay, it contributed to driving the yen down and import prices up, fueling the return of inflation. Despite some adverse effects, banking systems didn’t collapse as feared.
Tough Road for New Buyers: Changes to the market for mortgage-backed securities mean the all-important 30-year mortgage rate might not decline as quickly as many hope, even if the Federal Reserve cuts interest rates later this year. Economists at Fannie Mae recently increased their forecast for average 30-year fixed mortgage rates to be 6.4% on average in Q4’24, up from their prior forecast of 5.9%. They are also expecting an average rate of 6.2% in 2025.
Sourcing for this section: The Wall Street Journal, “Fed Officials Still See Three Interest-Rate Cuts This Year, Buoying Stocks,” 3/20/2024; The Wall Street Journal, “Stock Market Today, March 20, 2024: Indexes Close at Record Highs After Fed Holds Rates Steady,” 3/20/2024; The Wall Street Journal, “Global Era of Negative Interest Rates Ends as Japan Goes to Zero,” 3/19/2024; and The Wall Street Journal, “The New Normal for Mortgage Rates Will Be Higher Than Many Hope,” 3/22/2024
The S&P 500 Is Having a Top 15 Performance In Q1
The present is the past rolled up for action, and the past is the present unrolled for understanding.
—Will Durant
We often say that data is our love language at Blueprint Investment Partners. So, any time the market displays behavior we think might be interesting, we love to explore it. Sometimes that exploration results in something that truly is interesting, and sometimes it turns out to be nothing. Either way, the process of examining the data is endlessly fascinating for us.
Last year (2023) was a classic example of this. As the first half of the year closed on a tear, we wanted to see how it compared to other strong-performing first halfs, as well as how the year typically concluded under such circumstances. We found 2023 was indeed among the best starts in the S&P 500 Index. Moreover, following a top-10 performance during the first half of the year, the index always ended the year higher than its mid-year close, never lower. This study set the stage for an interesting real-time experiment throughout the remainder of 2023, as the index declined and appeared on pace to finish lower, then rallied in the last 60 days, and end higher once again.
Fast forward to 2024. Another similarly strong start has our attention. Given the fast start for the year in equity markets, we became curious where this year’s first quarter ranks historically and what the subsequent returns have looked like. To examine this, we went back in our data archives and pulled out S&P 500 Total Return data going back to 1928. This near-100-year sample gives us 96 first-quarter observations to analyze.
We found that out of 96 first quarters since 1928, 2024 is at the 15th-best position, with a return of just over 10%. To get in the top 10, the index would have needed an additional 3% return. Breaking into the top five would have required an additional 5%. In case you’re wondering, the best first quarter since 1928 occurred in 1975, with the benchmark index returning a scorching 23%. The average return of this group is just over 15%, and the overall average for Q1 is 2.5%.
Best Q1 Performance for the S&P 500
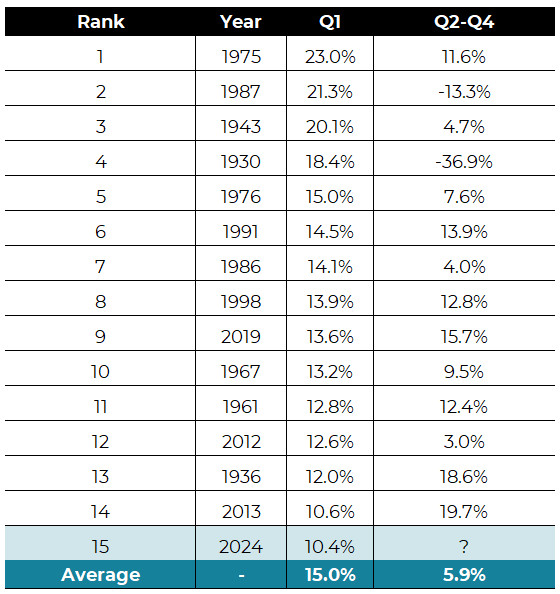
Source: ICE, S&P 500 TR, 10/1/1928 to 3/27/2024
So what happens from here? Well, if you are expecting an answer other than “we don’t know,” then welcome to the Blueprint Investment Partners Co-Founders’ Note, since you must be new here.
It probably sounds like a broken record now (by the way, I wonder if younger financial advisors know what that expression means?), but as trend followers we believe the best predictor of what a market will do is what it is doing. So with trends up and our portfolios situated as described above, our expectation is for that to continue.
With that said, it can be useful to look at what has happened before, if for no other reason than to remind ourselves that anything can happen and we should prepare accordingly. For instance, the data shows that out of the top 14 (ignoring 2024) Q1s, only two finished the year lower, but boy were they biggies (1930 and 1987). With those two outliers included, the average April to December return among this top-14 group is 5.9%.
Except for 1930 and 1987, the market has generally shown consistent persistence after a strong first quarter. We suspect many would argue that enhanced market and regulatory controls instituted during the last several decades make the risk of another ’87-style crash very low. That’s probably correct, but we wouldn’t do anything different regardless.
The general conclusion is that good starts historically correlated with good finishes. The beauty of a systematic investing process, in our opinion, is that it doesn’t matter ultimately. With prices trending higher and volatility remaining low, we think investors should enjoy these periods and stop worrying about what happens next. For financial advisors who partner with Blueprint Investment Partners, we believe this is particularly true since our strategies stand ready to trigger action if prices dictate it.
Sourcing for this section: GFD, SPDR S&P 500 ETF Trust (SPY), 2/1/1993 to 7/26/2023; and ICE, S&P 500 TR, 10/1/1928 to 3/27/2024
Best regards,


Jump To: Asset Allocation Update
View Archive: Co-Founders' Monthly Notes
Let's Talk
If you’d like to learn more about Blueprint's repeatable and disciplined application of a systematic investing process