Side Effects of the Stock Market May Include…
Pretty much everyone has experienced the agony having their TV watching interrupted by the ubiquitous pharmaceutical advertisement. In fact, they have become so commonplace that an assortment of entertaining spoofs have been created, like this one.
As the video above highlights, one of the memorable aspects for many of these medications is the absurdly long list of expected and potential side effects. Now, I respect the fact that these disclosures are important in providing consumers the necessary information to make an informed decision, but that doesn’t eliminate the irony of risking death for seasonal allergy relief.
After enduring yet another round of drug ads during a recent weekend of baseball, I was struck by the similarities between prescription medication and the stock market. Both are designed to address a specific problem, from eczema to paying for long-term healthcare and education expenses. Both also have side effects.
 Drowsiness, headaches, and upset stomach are relatable issues when taking medicine, but what about investing? If you are using the stock market as the main vehicle for achieving your clients’ financial goals, then you know a primary side effect is uncertainty expressed in the form of volatility and drawdowns in account value.
Like drug side effects, investing side effects can cause clients to stop using the “medicine,” which can take them back to square one, or even make them worse off than when they started.
COULD SYSTEMATIC INVESTING BE A MEDICATION TO MANAGE UNCERTAINTY?
Using systematic investing to focus on asset prices (trend following) is a process some believe can lessen those side effects.
To examine this, I analyzed the results of using a very basic form of systematic investing, which is to own stocks when their price is above the previous 200-day average (aka “uptrend”) and to sell or be out of stocks when they are below their 200-day average (“downtrend”).
I used the SPDR S&P 500 ETF Trust (SPY) since its inception in 1993 through June 2022 and considered its performance in three regimes:
- The full sample (buy-and-hold)
- When in uptrends: Price was above the 200-day average when the month ends
- When in downtrends: Price was below the 200-day average when the month ends
For each regime, I looked at four key metrics:
- Compound annual growth rate (CAGR)
- Annualized volatility
- Maximum drawdown (the max daily peak to trough decline)
- Sharpe ratio (a measure of return versus risk)
SEVERE SIDE EFFECTS ARISE WHEN OWNING STOCKS DURING DOWNTRENDS
The first exhibit establishes the baseline and illustrates the performance of each regime.
Exhibit A: Performance of Each Regime
| CAGR | Volatility | Drawdown | Sharpe Ratio | |
| Full Sample (buy-and-hold) | 9.0% | 14.9% | -51.1% | 0.6 |
| In Uptrends (price above 200-day average) | 9.3% | 12.0% | -16.4% | 0.9 |
| In Downtrends (price below 200-day average) | -0.7% | 21.8% | -66.2% | 0.0 |
Source: Brandon Langley and ICE, 11/1/1993 to 6/30/2022, net of fees
In my view, it is immediately apparent that there are severe side effects associated with owning stocks when the S&P 500 is in downtrends. Volatility was nearly double, drawdown was substantially worse, and the return was essentially zero. In other words, when viewed in isolation, the case for owning stocks is not compelling during this definition of a downtrend.
The second regime, which used a simple trend-following rule that only owned stocks when price was above the 200-day average, substantially lowered volatility and drawdown, but still left the “medicine” of higher absolute and risk-adjusted returns when the market was in uptrends.
SYSTEMATIC INVESTING SCENARIO 1: MANAGING RISK DURING DRAWDOWNS
Now that the data has established the significant drag associated with owning stocks when they are trending down, it begs the question: What could an advisor own instead of cash when the S&P 500 is in downtrends?
Using cash as the allocation is mathematically acceptable but both unnecessary and practically unreasonable due to compliance restrictions on applying advisory fees to widespread cash holdings. Short-term investment-grade bonds are similarly lower-volatility instruments, so my analysis used the Vanguard Short-Term Bond Index Fund (VBISX).
I compared the full sample (buy-and-hold) to a model portfolio that owned stocks when in uptrends and owned short-term bonds when stocks were in downtrends.
Exhibit B: Using Trend Following to Purchase Short-Term Bonds When Stocks in Downtrends
| CAGR | Volatility | Drawdown | Sharpe Ratio | |
| Buy-and-Hold During the Full Sample | 9.0% | 14.9% | -51.1% | 0.6 |
| Systematic Investing During the Full Sample (Using Bonds) | 10.7% | 10.6% | -18.2% | 1.0 |
Source: Brandon Langley and ICE, 11/1/1993 to 6/30/2022, net of fees
The systematic investing approach outperformed the buy-and-hold strategy on all four measures. It also performed better than the minimalistic trend-following system illustrated by Exhibit A, which would have moved to cash when stocks were in downtrends. The approach that used short-term bonds (Exhibit B) rather than cash improved CAGR by 1.4% (10.7% vs. 9.3%), while also lowering volatility and improving the Sharpe ratio.
Here’s another way of viewing the data:
Exhibit C: Absolute Return of Each Regime (growth of a of $1,000 investment)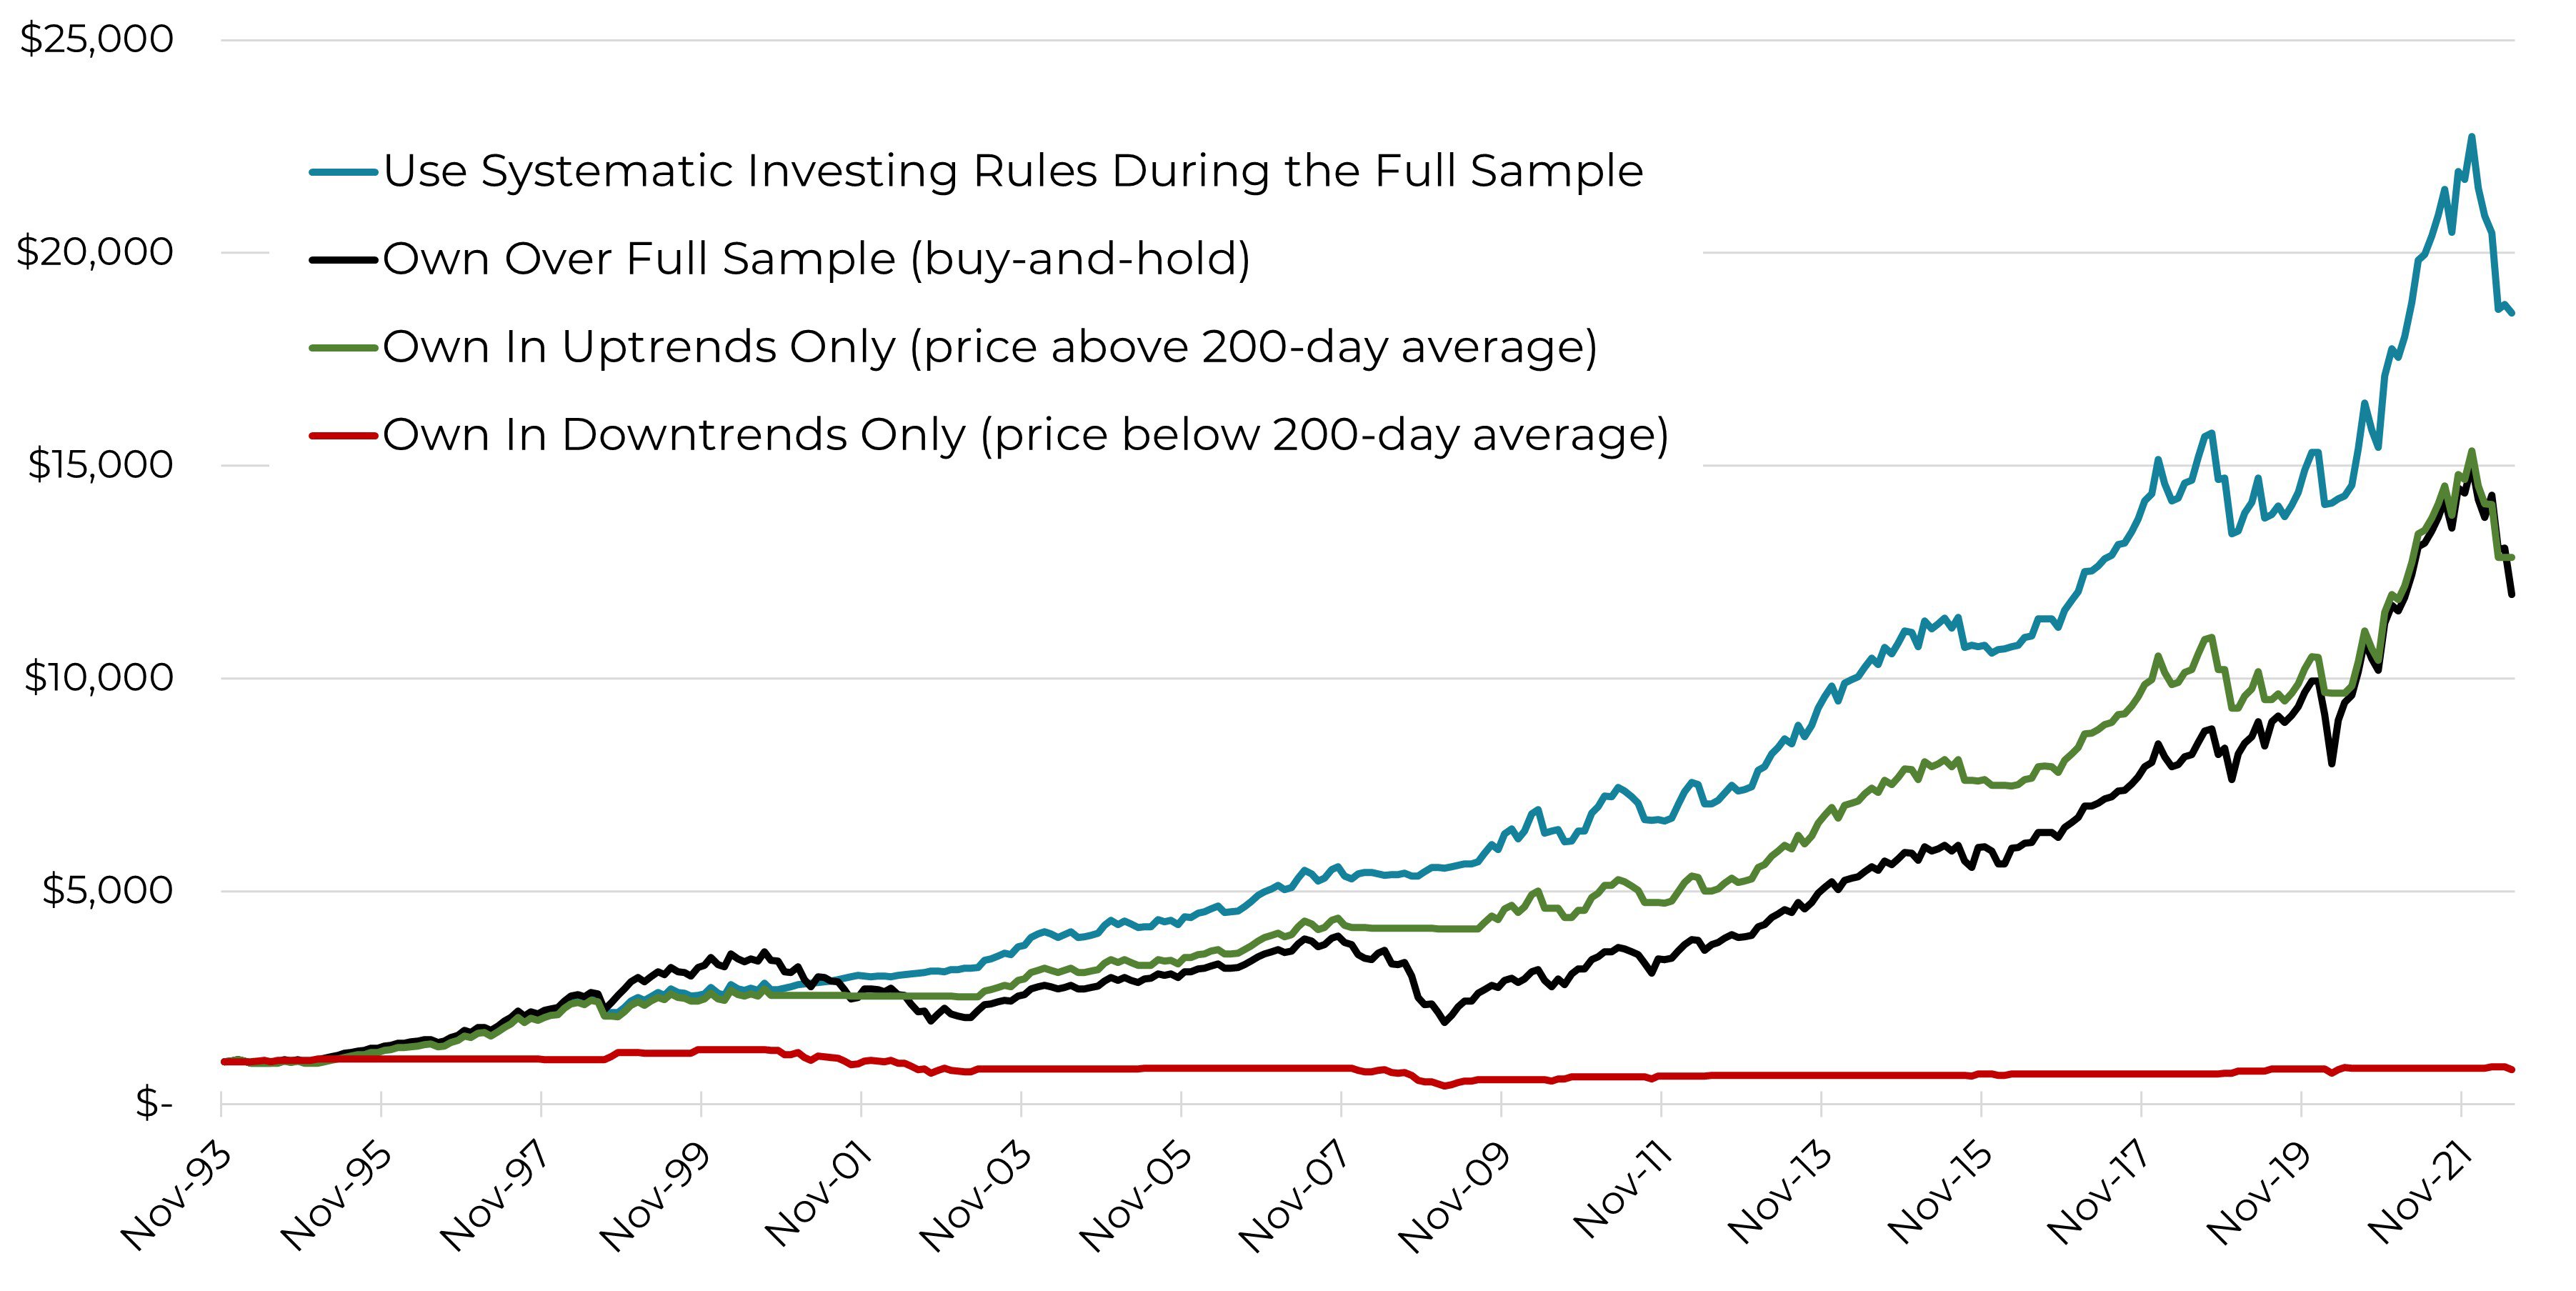
Source: Brandon Langley and ICE, 11/1/1993 to 6/30/2022, net of fees
For simplicity and brevity, I will stop here, as the data shows how holding stocks in downtrends is quantifiably detrimental and getting anything in return during these periods creates a more optimal investment strategy. However, financial advisors who are interested in seeing the impact of using higher-duration fixed income instruments as a substitute for cash and/or a different trend system are welcome to contact me.
SYSTEMATIC INVESTING SCENARIO 2: ALLOCATING MORE AGGRESSIVELY DURING UPTRENDS
Notice that volatility was much lower for the regime that only held stocks when they were in uptrends (Exhibit A). It’s also true for the systematic investing strategy that purchased short-term bonds when stocks were in downtrends (Exhibit B).
What if an investor was comfortable with the long-term volatility profile of a buy-and-hold strategy (14.9%) but wanted to take advantage of the trend-following approach’s risk management in an attempt to increase their total return?
Here’s how I tested this question. I looked at the full sample, but during times when stocks were in uptrends, I utilized just enough leverage to equate the volatilities of the systematic-investing and buy-and-hold models. To examine how performance is impacted in a simple and efficient manner, I chose the ProShares Ultra S&P 500 (SSO) because it allowed me to use a single ETF that’s easy to purchase.
The table below shows how trend following can potentially enhance returns without sacrificing risk.
Exhibit D: Using Trend Following to Purchase a Leveraged ETF When Stocks in Uptrends
| CAGR | Volatility | Drawdown | Sharpe Ratio | |
| Buy-and-Hold During the Full Sample | 9.0% | 14.9% | -51.1% | 0.6 |
| Systematic Investing During the Full Sample (Using SSO) | 14.7% | 14.9% | -24.2% | 1.0 |
Source: Brandon Langley and ICE, 11/1/1993 to 6/30/2022, net of fees
Although I used SSO to test this question, I do not necessarily recommend that advisors incorporate leverage into their client portfolios. This is just a model to help illustrate the concept, but other investments and more complex approaches could be used instead. For example, some trend-following operators might use futures contracts, options, or other derivatives for their efficiency and liquidity.
CONTACT YOUR ASSET MANAGER IF YOU EXPERIENCE VOLATILITY LASTING LONGER THAN…
Because a systematic investing strategy can reduce volatility during downtrends, I have seen some financial advisors use it as an opportunity to position clients more aggressive than they would have with a strategic or passive portfolio. One approach is to “tier up” a client’s portfolio to seek a greater return for similar or lower risk.
For example, a client who has a moderate risk/return profile using a strategic or passive portfolio might instead be put in a growth-oriented trend-following strategy. Similarly, a client with a balanced profile might be moved up to moderate.
While no investment strategy comes without the side effect of risk, the role of an advisor is to seek to minimize its nature and severity.
Just like achieving seasonal allergy relief may include some drowsiness but should not bring the risk of death, achieving financial goals should not have to come with a high risk of significant, long-term account drawdowns and volatility.
Blueprint Investment Partners is an investment adviser registered under the Investment Advisers Act of 1940. Registration as an investment adviser does not imply any level of skill or training. The oral and written communications of an adviser provide you with information about which you determine to hire or retain an adviser. For more information please visit adviserinfo.sec.gov and search for our firm name.
Past performance is not indicative of future results. The material above has been provided for informational purposes only and is not intended as legal or investment advice or a recommendation of any particular security or strategy. The investment strategy and themes discussed herein may be unsuitable for investors depending on their specific investment objectives and financial situation.
Hypothetical Back-Tested Performance Disclosure: There are certain limitations inherent in hypothetical model results like those portrayed in this presentation, particularly that such hypothetical model returns do not reflect trading in actual client accounts and do not reflect the impact that material economic and market factors may have had on the adviser’s decision-making had the adviser actually been managing client funds. Unlike an actual performance record, hypothetical back-tested performance results do not represent actual trading. These types of simulated trading programs, in general, benefit compared to actual performance results because such simulated programs are designed with the benefit of hindsight. In addition, simulated trading does not involve or take into account financial risk and does not take into account that material and market factors may have impacted Blueprint Investment Partners decision-making, all of which can adversely affect actual trading results and performance. For example, the ability to withstand losses or adhere to a particular trading program in spite of trading losses are material points which can also adversely affect markets in general or the implementation of any specific trading program. Hypothetical back-tested performance does not represent actual performance, trading costs, or the impact of taxes and should not be interpreted as an indication of such performance.
Hypothetical Back-Tested Performance Assumptions & Limitations: (1) Hypothetical back-tested performance results are presented net of annual sub-advisory fees of 0.50% and assume the reinvestment of dividends and capital gains. The impacts of trading costs are not included in the performance results and will reduce client performance. (2) The data shown is hypothetical and is provided to illustrate historical risk and return performance had the strategies detailed below been available over the relevant time period shown. The investment strategy of the models are as follows:
- Full Sample (buy-and-hold): A bought-and-held strategy.
- In Uptrends (price above 200-day average), In Downtrends (price below 200-day average), Systematic Investing During the Full Sample (Using Bonds) & Systematic Investing During the Full Sample (Using SSO): A trend-following strategy with monthly re-balancing of the index allocation at the close of each month.
Information obtained from third-party sources is believed to be reliable though its accuracy is not guaranteed, and Blueprint makes no representation or warranty as to the accuracy or completeness of the information, which should not be used as the basis of any investment decision.
Information contained on third party websites that Blueprint may link to are not reviewed in their entirety for accuracy and Blueprint assumes no liability for the information contained on these websites.
Opinions expressed in this commentary reflect subjective judgments of the author based on conditions at the time of writing and are subject to change without notice.
No part of this material may be reproduced in any form, or referred to in any other publication, without express written permission from Blueprint.
An index is an unmanaged portfolio of specific securities, the performance of which is often used as a benchmark in judging the relative performance of certain asset classes. Investors cannot invest directly in an index. An index does not charge management fees or brokerage expenses, and no such fees or expenses were deducted from the performance shown.