Downturns May Look Similar, But Context Tells Us When To Act Different
March 31, 2025
Never laugh at live dragons.
—J.R.R. Tolkien
Not all threats are created equal. Two situations might look similar on the surface, but that doesn’t mean they should be treated the same.
This principle is especially true in markets, where risks can appear familiar but behave very differently based on what came before.
This is where a systematic investing process can show its strength. Rather than treating every downturn the same, it adapts to context — recognizing when a pullback is just noise versus when it might be the start of something more serious. That adaptability is especially relevant now, as recent signals have led our systems to reduce exposure to U.S. equities.
In this month’s Co-Founders’ Note, we revisit two market corrections that looked nearly identical in speed and magnitude — but triggered opposite portfolio responses. The difference wasn’t in the outcome; it was in the setup. And that distinction is exactly why we follow process over prediction.
But first, here’s a summary of our take on what transpired in the markets in March.
Asset-Level Overview: Market Talking Points for Financial Advisors
Equities & Real Estate
For U.S. equities, March started where February ended off, with stocks in a free fall from the last all-time high on February 19. The bleeding stopped, at least for now, March 13, with the S&P 500 Index bottoming and since making up some ground. The decline was enough to produce the first significant downtrend in U.S. equities since October 2023. In addition to being quick, the decline has also been broad, with all major U.S. equity segments falling. For the year, value and dividend stocks are the leaders, with growth and tech lagging — a flip of the script from 2023 and 2024. One similarity between the last three years is that small caps continue to be among the worst equity performers.
Another major trend reversal has taken place within international equities, which continue to lead in 2025 and are on pace for another monthly increase. Positive trends entering March continued. International’s outperformance relative to U.S. equities has now caused it to be stronger over the intermediate-term timeframe, though U.S. equities remain stronger over longer timeframes.
Real estate securities continue to tread water for now, underperforming stronger international equity segments while besting the weaker U.S. equity complex. Trends are also mixed, with both the intermediate- and long-term timeframes teetering on being negative. For April, allocations in our portfolios will remain underweight.
Fixed Income & Alts
While probably too early to classify this as a rally, fixed income instruments have slowly recovered, pushing lower-duration segments into uptrends across all timeframes. Beyond seven years or so in duration, trends remain mixed. A bright spot has been inflation-protected securities, which have strengthened to their highest point relative to other Treasuries since 2022. The result is that domestic bonds overall will be overweight in our portfolios, with the first meaningful allocation to TIPS in more than two years.
The largest allocation in the alternatives bucket remains a spread position where short-term bonds — predominantly Treasuries, TIPS, municipals, and corporates — are held long, while longer-duration Treasuries — both in the U.S. and abroad — are held short. Both sides of the trade have generally increased over the last month, which has muted performance. Among commodities, long positions in metals, livestock, and food products — such as cocoa and cotton — continue to outweigh shorts in grains. In currencies, short positions in most global banknotes against the U.S. Dollar have struggled as the domestic currency weakens. For stocks, the short book continues to grow, now nearly matching the long side in terms of exposure.
Sourcing for this section: Barchart.com, S&P 500 Index ($SPX), 1/1/2023 to 3/28/2025
3 Potential Catalysts for Trend Changes: Giving Clients the Context
Consumer Un-Confidence: Forward-looking consumer expectations fell to a 12-year low in a key consumer survey of household sentiment in March. The survey shows increasing evidence that people are taking a more moderated view of the economy. Analysts have been keeping a close eye on consumer surveys due to concerns that a gloomy mood could become a self-fulfilling prophecy and ignite an economic slowdown. In the backward-looking data, such as the unemployment rate and GDP figures, there have been scant signs of a downturn thus far.
Retail Still Spending: Retail sales rose modestly in the February data released during mid-March, showing that while consumer spending has slowed this year, it has not crumbled. Sales edged up a seasonally-adjusted 0.2% in February versus the prior month, but it was less than the 0.6% expected gain. Sales figures for January were also revised lower, falling to 1.2%. The slower-than-expected gain in February sales was concentrated in sales at automobile and auto-part dealers, where sales declined 0.4%.
Car Costs: President Donald Trump issued an executive order imposing 25% tariffs on all imported cars and trucks. Canada and Mexico account for about half of U.S. auto imports, with South Korea, Japan, and Europe accounting for most of the remaining imports. Tariffs are expected to increase car prices as much as $10,000 per vehicle, reduce sales, and hurt domestic auto dealers and workers.
Sourcing for this section: The Wall Street Journal, “Consumer Survey’s Decline Adds to Evidence of Gloom,” 3/25/2025; The Wall Street Journal, “Retail Sales Edge Up in February but Miss Expectations,” 3/17/2025; and The Wall Street Journal, “Trump’s Giant New Car and Truck Tax,” 3/27/2025
Not All Downturns Are Created Equal
It is not the blowing of the wind, but the set of the sails that determines our direction.
—Jim Rohn
One of the aspects of trend following that we think is unique is its ability to adapt to market conditions in such a way where it may treat two similar situations differently, depending on the surrounding circumstances. For example, consider the two real-time scenarios below:
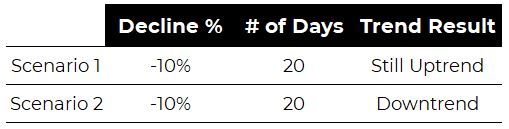
At first glance, nothing is different about these two scenarios except the outcome in terms of how we define trend. Both included a rapid decline from an all-time high in the S&P 500 Index. After 20 days, the index had fallen almost an identical amount. However, while one case resulted in a downtrend where our investing process cut U.S. equity exposure, the other caused us to stand our ground.
Scenario 1: The 2024 Case Study
The first scenario is from 2024. On July 16, the S&P made a fresh high only to quickly retrace, bottoming August 5. After experiencing one of its best annual starts in history, U.S. equities were allowed to “breathe” by our trend-following systems, giving them room to decline without overreacting. This turned out to be wise, as the index returned more than 6% from that point to the end of the year. This excess return might have been missed with a faster-acting system.
Scenario 2: The 2025 Case Study
The second scenario is what we are currently experiencing. After a high February 19, the S&P has again declined 10% in 20 days. However, instead of standing pat, our trend-following systems are reading this as a clear downtrend in U.S. equities and are responding accordingly by cutting exposure.
What’s The Difference?
The major change from the summer of 2024 compared to early 2025 is the lead up to the decline. As we just mentioned, in 2024 U.S. equity markets were very strong and thus given some room to run. On the contrary, the lead up to the 2025 decline has been less robust, causing our systems to take a more cautious approach.
We now have the benefit of hindsight to say that our decision to stay allocated in 2024 was good in terms of outcome. This is not yet the case with 2025. Regardless of the end results, we are reminded of the importance of process OVER outcome.
Systematic, rules-based strategies have the benefit of being able to be backtested over large, diverse samples of data. This allows us to not only review overall results to determine if they are acceptable, but it also gives us the ability to review individual situations along the way. See, no investment strategy is perfect. All have strengths and weaknesses. In our opinion, the goal is to have those strengths and weaknesses align to what is best for a financial advisor and their clients.
Looking Forward
It is unlikely that April will be the most satisfying month from a trend perspective. Since our portfolios are underweight U.S. equities, if there is a rebound, we will lag. On the other hand, if U.S. equities continue to fall, we will likely also fall but to a lesser degree. If you think of our trend-following system as being like a stoplight, we are in yellow light mode: slowing down but not stopping.
While we may be slowing down, we believe we are still moving in the right direction. We are poised to go to our most defensive position should downtrends build, but we are also able to quickly revert to a “risk on” stance if we see a rally similar to that of August and September 2024. As we said, no system is perfect, but we find it comforting to have a plan for any scenario the markets may throw at us.
Sourcing for this section: Barchart.com, S&P 500 Index ($SPX), 1/1/2024 to 3/28/2025
Best regards,


Jump To: Asset Allocation Update
View Archive: Co-Founders' Monthly Notes
Let's Talk
If you’d like to learn more about Blueprint's repeatable and disciplined application of a systematic investing process