September 16, 2025
September 2025 Commentary Blueprint Chesapeake Multi-Asset Trend ETF
Home » Strategies » Exchange Traded Funds » Blueprint Chesapeake Multi-Asset Trend » TFPN Commentary
Portfolio Exposure At A Glance
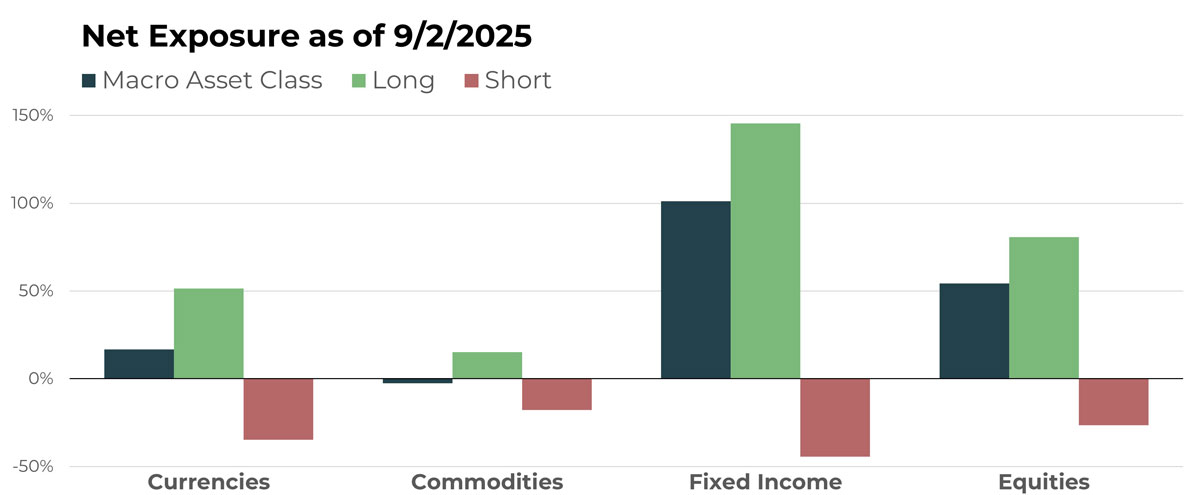
Notable Holdings By Macro Asset Class
| CURRENCIES | |
|---|---|
| Name | Long/Short |
| British Pound Sterling/China Yuan | Long |
| Mexican Peso/U.S. Dollar | Long |
| Korean Won/U.S. Dollar | Short |
| Euro/Hungarian Forint | Short |
| China Yuan/U.S. Dollar | Short |
| COMMODITIES | |
|---|---|
| Name | Long/Short |
| Silver Future | Long |
| Nickel Future | Short |
| Cocoa Future | Long |
| Gold Future | Long |
| Rough Rice Future | Short |
| FIXED INCOME | |
|---|---|
| Name | Long/Short |
| iShares 0-5 Year TIPS Bond ETF | Long |
| iShares Short Term National Muni Bond ETF | Long |
| U.S. 30-Year Treasury Bond | Short |
| U.S. 2-Year Treasury Note | Short |
| Australian 10-Year Bond | Short |
| EQUITIES | |
|---|---|
| Name | Long/Short |
| Agnico Eagle Mines Ltd | Long |
| Canadian National Railway | Short |
| Mccormick & Co Inc | Short |
| Archer Daniels Midland | Long |
| Axon Enterprise | Long |
ETF holdings and macro asset class allocations are subject to change.
Currencies
Overview
Exposure to foreign currencies once again increased in August as the U.S. Dollar remained rangebound before finishing lower compared to July. Of the 25 currency positions held at the end of August, only seven reflected a stronger U.S. Dollar. The largest concentration of weaker currencies was in the Asia Pacific region. Crypto exposure also increased slightly month over month.
Drivers
The Mexican Peso once again held a top spot in terms of allocation size relative to the U.S. Dollar, followed by the Israeli Shekel. Eastern European and Nordic currencies continue to rank among the strongest globally. The British Pound and Swedish Krona also remain strong relative to other currencies at the moment.
Commodities
Overview
Commodity shifts were muted in August except for a significant move short in grain futures. This allocation is now the second-largest net position, behind only the long livestock allocation. Metals and softs also remained net long, with metals increasing slightly and softs falling slightly.
Drivers
Cattle and cocoa futures once again occupied the two spots among commodity positions. Gold followed closely as it broke out of its recent range to close August at a new high. On the short side, soybeans and related products, along with wheat, made up the largest allocations.
Fixed Income
Overview
Fixed income futures and ETFs were little changed heading into September. Bonds of intermediate- to long-term duration remained net short, while fixed income ETFs — primarily corporates, municipals, and inflation-indexed bonds — remained net long. The biggest change was an increased net long exposure to short-term bonds. Already the largest dollar position in TFPN, this allocation increased again at the start of September.
Drivers
Among fixed income ETFs, short-term municipals continued to make up the largest allocation, closely followed by short-term TIPS. The Australian 10-year bond remained the largest short position among medium- to long-duration instruments by a wide margin. Within short-term fixed income futures, the largest long positions were concentrated in the Eurozone.
Equities
Overview
Despite a small increase in short equity positions, overall net long exposure to equities increased for the third consecutive month. With this increase, equities remain the second-most-influential asset class in TFPN on a dollar basis — and is likely the largest when accounting for the underlying volatility characteristics.
Drivers
Strategy Inc., AZZ Inc., and TKO Group Holdings remain large equity holdings in TFPN, supported by entrenched uptrends. As first noted in last month’s update, equity breadth continues to expand on both the long and short sides. A wider set of positions increases the likelihood of capturing the kinds of outlier moves that can drive investor outcomes.
Portfolio Managers’ Note
TFPN has quietly benefitted from sustained moves in equities, short-term bonds, and commodities like gold to post its fourth-consecutive monthly increase. In a span where portfolio stalwarts like stocks and bonds have performed well, TFPN has also seen gains. This highlights the benefits of noncorrelation versus negative correlation.
Negative correlation is valuable during times of market chaos. However, in the U.S. historically, stocks —represented by major indexes like the S&P 500 — tend to move disproportionately higher over time. Owning a negatively correlated asset to stocks can therefore be a losing proposition without a robust system for entering and exiting. We instead prefer noncorrelation, which not only has periods of strong outperformance when stocks fall but can also thrive when stocks rise, as the past four months demonstrate.
Noncorrelation is not without its tradeoffs. While it can be powerful, it is inherently less predictable in its performance path than a positively or negatively correlated asset. Surprisingly, we have found that many financial advisors and investors prefer correlated assets because they appear more predictable — even though, statistically, we believe they are inferior contributors to a diversified portfolio. We suspect few advisors would admit that outright, but the questions we receive suggest otherwise.
Executing noncorrelation requires discipline and an almost dogmatic focus on investing process over outcome. Significant work is needed on the front end to design, understand, and build conviction in the investing system that aims to generate noncorrelation. Once established, the focus must shift from design to execution. We would argue this holds true for most successful systems in life.
Four months — or even four years — is not long enough to draw sweeping conclusions. But in the context of a strategy with a long history, like TFPN has, recent performance is another example of how trend following can help portfolios.
TFPN remains positioned to benefit from established stock trends. Other asset classes are showing less agreement on trends – or in the case of fixed income, less volatility of trend – which may dampen outsized return potential. However, within a diversified portfolio, we believe the fund can continue to deliver reliable correlative benefits as we march toward the end of 2025.
The performance data quoted represents past performance. Past performance does not guarantee future results. The investment return and principal value of an investment will fluctuate so that an investor’s shares, when sold or redeemed, may be worth more or less than their original cost and current performance may be lower or higher than the performance quoted.
For standardized performance please visit tfpnetf.com.
Let's Talk
If you’d like to learn more about TFPN, a next-generation liquid alternative