October 21, 2025
October 2025 Commentary Blueprint Chesapeake Multi-Asset Trend ETF
Home » Strategies » Exchange Traded Funds » Blueprint Chesapeake Multi-Asset Trend » TFPN Commentary
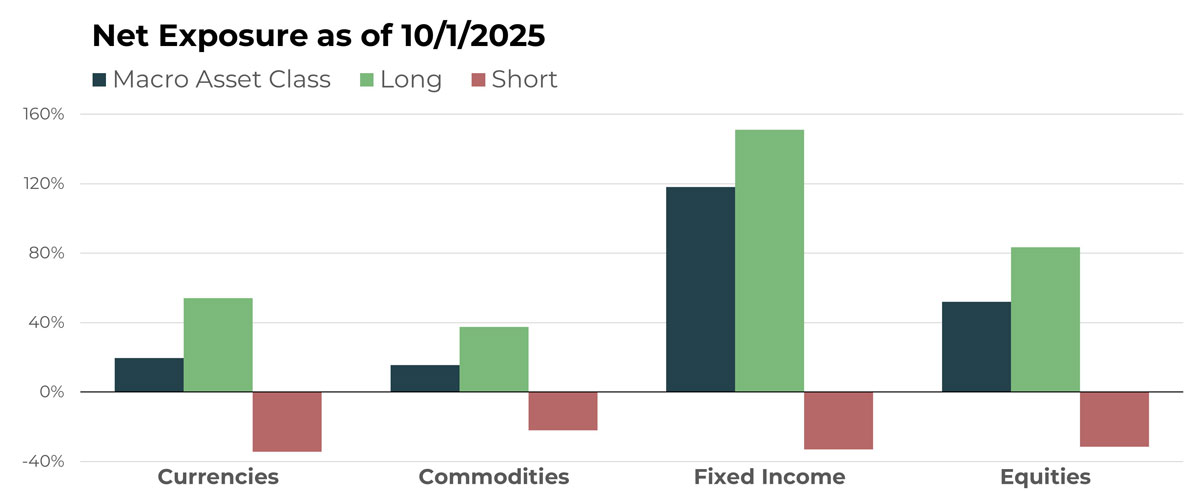
Portfolio Exposure At A Glance
Notable Holdings By Macro Asset Class
| CURRENCIES | |
|---|---|
| Name | Long/Short |
| British Pound Sterling/China Yuan | Long |
| Mexican Peso/U.S. Dollar | Long |
| Korean Won/U.S. Dollar | Short |
| Euro/Hungarian Forint | Short |
| China Yuan/U.S. Dollar | Short |
| COMMODITIES | |
|---|---|
| Name | Long/Short |
| Copper Future | Long |
| Lead Future | Short |
| Sugar Future | Short |
| Heating Oil Future | Long |
| Oats Future | Short |
| FIXED INCOME | |
|---|---|
| Name | Long/Short |
| Japan 10-Year Treasury Bond | Short |
| U.S. 3-Year Treasury Note | Long |
| U.S. 10-Year Treasury Bond | Long |
| U.S. 2-Year Treasury Note | Short |
| Australian 10-Year Bond | Short |
| EQUITIES | |
|---|---|
| Name | Long/Short |
| Bank of Nova Scotia | Long |
| Canadian National Railway | Short |
| Northrop Grumman | Long |
| Centrus Energy | Long |
| Devon Energy Corp | Short |
ETF holdings and macro asset class allocations are subject to change.
Currencies
Overview
Relative to the U.S. Dollar, exposure to foreign currencies did not change much last month, as the American currency continued to stabilize following its decline earlier in the year. Crypto exposure also did not change and remains net long, with positions in Bitcoin and Ethereum. The most notable adjustment occurred within the foreign cross-rate segment, particularly across the Asia-Pacific region.
Drivers
The most meaningful trend development came from Australia, where the Aussie Dollar strengthened after the Reserve Bank of Australia adopted a more hawkish tone amid persistent inflation. This bullish catalyst lifted the currency’s value versus the New Zealand Dollar, Canadian Dollar, and Chinese Yuan. The latter two cross-rates shifted from short to long exposure in the portfolio, reflecting the Australian Dollar’s improving trend.
Commodities
Overview
Commodities saw a modest increase in net long exposure as Q3 concluded. Energies remain slightly net long, and grains remain net short. Livestock exposure also continues to be net long but was reduced again last month. The largest shifts occurred in the food/fiber and metals segments — the former is now at its lowest exposure of the year, and the latter at its highest level of 2025.
Drivers
Gold is now the portfolio’s largest single long position within commodities. In aggregate, it trails only the combined cattle futures allocation, which has declined meaningfully. Alongside gold, the metals segment has seen increases or new positions in copper, silver, and iron ore. Overall, metals now represent the largest net exposure across the commodity book.
Fixed Income
Overview
Without question, the most significant exposure change since our last update occurred within fixed income. For both intermediate-duration bonds and short-term instruments, the portfolio’s long allocation has increased. In fact, duration-based instruments have shifted from net short to net long — a relatively rare reversal in such a short timeframe. Already the portfolio’s largest net allocation, fixed income has further expanded its influence.
Drivers
The dynamics noted earlier in the Australian Dollar are also influencing its bond market, where a strong economy and persistent inflation have supported higher interest rates and, in turn, weaker bond prices in the country. Conversely, in the U.S., a pivot toward a more dovish stance has bolstered domestic bond prices, resulting in additional long exposure in our portfolio. Elsewhere, short-term bonds remain entrenched in uptrends, while municipals, corporates, and TIPS also continue to exhibit bullish trends.
Equities
Overview
U.S. equities advanced in September, with the S&P 500 gaining more than 3% as strength in technology and communication services outweighed weakness in consumer staples and utilities. Financials and industrials also contributed modestly, while energy was mixed despite higher oil prices. Within that context, the portfolio again saw a modest uptick in short positions, offset by growth on the long side. The net result was little change in the overall net long allocation to equities.
Drivers
Many of the same drivers remain in place, with Strategy Inc., AZZ Inc., and TKO Group Holdings continuing to represent significant holdings. Alongside these stalwarts, several new positions have emerged in the mining and defense sectors. On the short side, the two largest positions are in Fiserv and Procter & Gamble.
Portfolio Managers’ Note
TFPN once again used a unique blend of unrelated positions to produce its fifth-consecutive monthly increase in September. The bullish run in stocks has dominated financial headlines, and TFPN continued to participate through its net long equity exposure described in the previous section. However, performance was also supported by gains across currencies, commodities, and fixed income.
There are many multi-asset diversified ETFs available to investors, but few possess the ability to benefit from such a wide array of independent trends. September offers a good example: positive attribution came from the Australian Dollar, copper, intermediate-term bonds, and U.S. stocks. The non-correlation among these positions can be maddening at times for those hyper-focused on domestic equity indexes, but we believe the durability of a broad, trend-based approach is unparalleled.
One of the most interesting aspects of trend following, in our view, is that it takes an open mind to truly appreciate it. It’s an acquired taste — like dining at a new restaurant. You can order the burger and probably enjoy it, but you’ll never know what you missed. Or you can take the chef’s recommendation and perhaps have an experience that changes the way you think about food. That’s what trend following is to us — and what it has become for many of the financial advisors we serve.
We believe TFPN’s uniqueness, particularly its ability to hold and benefit from such a wide range of positions, is a key reason to consider it a staple in a portfolio. It’s unlikely any investor already holds something redundant to TFPN. As we often say, the best strategy for something that has never happened before is one dependent on the fewest things. We believe TFPN fits that description well.
The performance data quoted represents past performance. Past performance does not guarantee future results. The investment return and principal value of an investment will fluctuate so that an investor’s shares, when sold or redeemed, may be worth more or less than their original cost and current performance may be lower or higher than the performance quoted.
For standardized performance please visit tfpnetf.com.
Let's Talk
If you’d like to learn more about TFPN, a next-generation liquid alternative