August 18, 2025
August 2025 Commentary Blueprint Chesapeake Multi-Asset Trend ETF
Home » Strategies » Exchange Traded Funds » Blueprint Chesapeake Multi-Asset Trend » TFPN Commentary
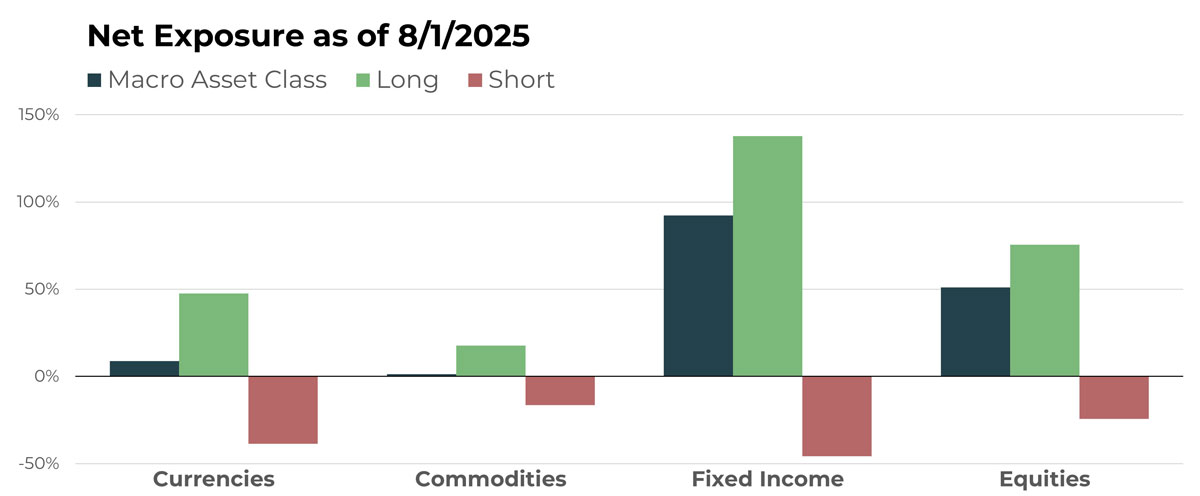
Portfolio Exposure At A Glance
Notable Holdings By Macro Asset Class
| CURRENCIES | |
|---|---|
| Name | Long/Short |
| iShares Bitcoin Trust ETF | Long |
| Indian Rupee/U.S. Dollar | Long |
| Indonesian Rupiah/U.S. Dollar | Short |
| Euro/Czech Koruna | Short |
| China Yuan/U.S. Dollar | Short |
| COMMODITIES | |
|---|---|
| Name | Long/Short |
| Copper Future | Long |
| Lumber Future | Short |
| Cattle Future | Long |
| Gold Future | Long |
| Lead Future | Short |
| FIXED INCOME | |
|---|---|
| Name | Long/Short |
| iShares 0-5 Year TIPS Bond ETF | Long |
| iShares Short Term National Muni Bond ETF | Long |
| U.S. 30-Year Treasury Bond | Short |
| U.S. 2-Year Treasury Note | Short |
| Australian 10-Year Bond | Short |
| EQUITIES | |
|---|---|
| Name | Long/Short |
| AZZ Inc | Long |
| T. Rowe Price Group Inc | Short |
| Pepsico Inc | Short |
| Zscaler Inc | Long |
| Coinbase Global Inc | Long |
ETF holdings and macro asset class allocations are subject to change.
Currencies
Overview
The U.S. Dollar bounced back slightly from multi-year lows in July, but not enough to shift its relative positioning in the portfolio — exposure to foreign currencies actually increased. Internationally, the Nordic countries remain among the strongest, followed by Great Britain. Asia and Asia Pacific continue to be among the weakest. Exposure to crypto and blockchain-related currencies also increased during the month.
Drivers
Relative to the U.S. Dollar, the Mexican Peso continues to hold the top spot in terms of allocation size. While the portfolio is generally short the U.S. Dollar, some notable currencies are even weaker, such as the Indonesian Rupiah and the Chinese Yuan. Within the international cross-rate book, the two largest positions are both against the Euro: the Czech Koruna and the Hungarian Forint.
Commodities
Overview
A slight rotation occurred in July, as dominant long exposure in livestock and softs lessened, while allocations to energies and metals increased. Metals have now surpassed the softs segment as the second-largest net long position within the commodity book. Meanwhile, the net-short exposure in grains has narrowed, with longs now nearly equal to shorts.
Drivers
Cattle and cocoa futures were neck and neck as the largest commodity positions heading into August. Gold also remains a top holding, though it has now been surpassed by South African wheat, a large net long position that diverged from its U.S. counterpart and rose more than 5% in July (August contract).
Fixed Income
Overview
With the exception of fixed income ETFs — which are primarily composed of corporates, municipals, and inflation-indexed bonds and saw a slight increase in net long exposure heading into August — the rest of the fixed income segment experienced a decrease in net positioning. Intermediate- to long-duration bonds remain weak and net short, though that short exposure faded slightly in July. Short-term bonds continue to represent the largest single segment of the portfolio, but the size of the net long position declined.
Drivers
Among fixed income ETFs, short-term municipals make up the largest allocation, followed by short-term TIPS. The Australian 10-year bond remains the largest short position among medium- to long-duration instruments. Within short-term fixed income futures, the largest long positions are concentrated in the Eurozone.
Equities
Overview
After nearly doubling long equity exposure coming into July, the allocation once again increased heading into August. Just a few months ago, the equity portfolio was nearly hedged, with longs roughly equal to shorts. Now, as markets have climbed to new all-time highs, TFPN is positioned with long equities as the second-most-influential piece of the portfolio on a dollar basis — and the most influential when adjusted for underlying volatility.
Drivers
The same names and trends that have held the highest exposures continue to do so. Strategy Inc., AZZ Inc., and TKO Group Holdings remain the largest equity holdings in TFPN due to entrenched uptrends. What’s notably different now about the equity portfolio is its breadth. In June, the equity book held approximately 102 names, followed by 119 in July. In August, that number climbed to more than 130 — once again highlighting the breadth of holdings in TFPN’s equity portfolio.
Portfolio Managers’ Note
In endurance sports, specifically running, there’s a sentiment we appreciate: To love running, you have to hate it a little too.
The idea is that the discomfort, pain, and mental challenge of running contribute to what makes it so rewarding. Endurance sports carry this paradox: struggle and satisfaction go hand in hand. We think the same can be said of trend following.
To excel at trend-following investing, you have to embrace the painful periods — like those observed in late 2024 and early 2025. Like running, pushing through those walls leads to adaptation. Over time, that makes it easier to accept and even expect struggle. The key difference is that while running is physical, investing is entirely mental — and, more precisely, psychological.
Another similarity between endurance sports and trend following is the tendency for outsiders to ask,
“Why?” Why endure the pain? Why be different from the status quo?
The answer is simple: because we believe in this systematic investing process so completely that doing it any other way feels profoundly wrong. And that belief isn’t based on blind faith — it’s grounded in decades of research and lived experience.
Frankly, we love the naysayers. They’re part of the reason our edge exists — and why there will always be a niche aspect to both what we do and the financial advisors we serve.
Quietly, TFPN has now posted three consecutive months of positive performance. That’s happened during a stretch when equities have also done well. This highlights the fund’s noncorrelated properties. Does this short period of gains tell us anything about how the year will end? Candidly, no. But that’s the thing about trend following — just when the naysayers begin writing it off, it often goes on a run. Quietly at first. Then loudly.
The performance data quoted represents past performance. Past performance does not guarantee future results. The investment return and principal value of an investment will fluctuate so that an investor’s shares, when sold or redeemed, may be worth more or less than their original cost and current performance may be lower or higher than the performance quoted.
For standardized performance please visit tfpnetf.com.
Let's Talk
If you’d like to learn more about TFPN, a next-generation liquid alternative